
The Week That Was
U.S. equities were mixed as investors digested the Federal Reserve's first rate hike since 2023, another move above 5% in the 10-year Treasury yield, and continued volatility in oil prices. The SPX slipped 0.1%, the Dow fell 1.7%, and the R2K declined 1.5%, while strength in semiconductors and other technology shares helped the Nasdaq gain 0.7%. Market leadership remained narrow with healthcare (XLV) and technology (XLK) the strongest areas of the market, gaining roughly 1.6% and 1.0%, respectively, while utilities (XLU) fell nearly 3% and financials (XLF) declined more than 2%. Growth outperformed value, while mid- and small-cap stocks lagged their large-cap counterparts. The underlying breadth was considerably weaker than the headline S&P 500 return suggested, with roughly three-quarters of U.S. stocks tracked by Morningstar declining for the week.
Technology stocks successfully absorbed a call for a slower pace of AI development owing to safety concerns from a number of industry leaders. Monday's reaction was sharp as the Philadelphia Semiconductor Index fell nearly 6% as investors questioned whether additional safeguards would temper the enormous capital-spending cycle. However, the selloff was not uniform across technology as Alphabet and Meta actually rose as investors considered whether slower AI development could reduce the extraordinary capital requirements facing hyperscalers. Likewise, software and cybersecurity stocks also benefited from the prospect of greater emphasis on AI safety. Investors returned aggressively to AI infrastructure names helping the Nasdaq gain 1.7% on Thursday, with AMD, Micron and other semiconductor stocks participating as investors concluded that safeguards could be implemented without a significant spending slowdown and President Trump refused to accept losing ground to China.
The dominant macro development was the FOMC's unanimous 25 bps rate hike, which raised the federal funds target range to 3.75%–4.00%. Updated Fed projections indicated policymakers expect another 25 bps increase before year-end, reinforcing the message that persistent inflation remains the central bank's primary concern. The 10-year Treasury yield briefly reached 5.04%, its highest level since 2007, and finished the week near 5.01%, up from 4.96%. The 2-year yield rose more sharply, to roughly 4.76% from 4.63%, implying a flatter yield curve. Equities historically have often struggled in the first several months following an initial Fed hike before subsequently recovering, although the pace of tightening has historically mattered as much as the hikes themselves.
Energy remained a major source of cross-asset volatility. WTI crude traded above $106 at one point as attacks on Saudi energy infrastructure raised concerns about supply through the region, before easing later in the week. WTI ultimately settled Friday near $100.30/barrel, up about 0.2% for the week, while Brent slipped roughly 0.7%. Elevated energy and diesel prices are feeding directly into inflation expectations and the outlook for monetary policy.
Gold proved resilient despite the Fed hike and rising Treasury yields. Spot gold rose roughly 1% for the week to about $4,390/oz, snapping a three-week losing streak as the late-week pullback in crude reduced some inflation and rate concerns. Silver also strengthened, rising more than 3%.
U.S. Equity Market Summary — As of 9/18/26
| Asset Class | 1 Wk | 1 Mo | 3 Mo | YTD | 1 Yr | 3 Yr | 5 Yr |
|---|---|---|---|---|---|---|---|
| S&P 500 | -0.06% | -0.41% | +2.28% | +12.71% | +16.71% | +21.35% | +13.14% |
| Dow Jones Industrials Average | -1.69% | -2.85% | +0.61% | +8.82% | +13.83% | +16.32% | +10.43% |
| NASDAQ | +0.72% | +0.97% | +0.15% | +14.61% | +18.74% | +25.45% | +12.83% |
| S&P MidCap 400 | -1.71% | -5.18% | -3.42% | +11.46% | +11.82% | +14.18% | +8.04% |
| Russell 2000 | -1.50% | -5.10% | -3.71% | +16.22% | +17.34% | +17.54% | +6.50% |
| Russell Micro Cap | -0.72% | -4.32% | -1.44% | +20.73% | +26.99% | +24.17% | +6.88% |
U.S. Sector Summary — As of 9/18/26
| Cyclical Sectors | 1 Wk | 1 Mo | 3 Mo | YTD | 1 Yr | 3 Yr | 5 Yr |
|---|---|---|---|---|---|---|---|
| Consumer Cyclical | -1.71% | -4.58% | -5.04% | -6.65% | -6.94% | +10.22% | +4.67% |
| Financials | -2.43% | -3.42% | +4.64% | +2.87% | +4.79% | +18.80% | +10.14% |
| Materials | -1.88% | -3.46% | -3.15% | +11.13% | +12.02% | +9.17% | +6.29% |
| Real Estate | -2.05% | -4.71% | -2.19% | +7.02% | +4.58% | +8.89% | +1.41% |
| Sensitive Sectors | 1 Wk | 1 Mo | 3 Mo | YTD | 1 Yr | 3 Yr | 5 Yr |
|---|---|---|---|---|---|---|---|
| Comm. Services | -1.59% | +0.30% | +1.51% | -5.32% | -5.65% | +19.26% | +7.01% |
| Energy | -1.27% | +0.99% | +20.45% | +45.80% | +47.80% | +15.11% | +25.60% |
| Industrials | -1.52% | -7.53% | -5.94% | +10.00% | +12.55% | +19.01% | +12.77% |
| Technology | +1.03% | +2.14% | -0.84% | +32.01% | +38.04% | +31.60% | +20.42% |
| Defensive Sectors | 1 Wk | 1 Mo | 3 Mo | YTD | 1 Yr | 3 Yr | 5 Yr |
|---|---|---|---|---|---|---|---|
| Consumer Defensive | -0.70% | -3.25% | +0.09% | +7.94% | +7.00% | +7.64% | +5.77% |
| Health Care | +1.83% | -0.79% | +13.20% | +9.70% | +24.62% | +10.28% | +6.54% |
| Utilities | -3.04% | -6.63% | -7.59% | -2.44% | +0.08% | +11.49% | +7.54% |
US Equity Style Summary — As of 9/18/26
| Equity Style | 1 Wk | 1 Mo | 3 Mo | YTD | 1 Yr | 3 Yr | 5 Yr |
|---|---|---|---|---|---|---|---|
| Large Growth | +0.90% | +1.08% | +2.12% | +9.46% | +12.39% | +24.05% | +12.60% |
| Large Blend | -0.01% | -0.32% | +2.38% | +12.61% | +16.40% | +21.56% | +12.72% |
| Large Value | -1.21% | -2.21% | +2.72% | +17.13% | +21.64% | +18.19% | +12.56% |
| Mid Growth | -0.88% | -4.44% | -4.33% | +5.15% | +0.54% | +14.33% | +4.25% |
| Mid Blend | -1.29% | -3.74% | +0.16% | +11.07% | +11.17% | +15.90% | +7.25% |
| Mid Value | -1.58% | -3.21% | +3.73% | +15.24% | +19.21% | +16.65% | +9.81% |
| Small Growth | -0.74% | -5.60% | -5.17% | +12.25% | +11.31% | +15.81% | +3.59% |
| Small Blend | -1.34% | -4.58% | -2.12% | +13.00% | +13.21% | +15.73% | +6.87% |
| Small Value | -1.78% | -3.83% | +0.19% | +13.48% | +14.59% | +15.60% | +9.21% |
International Equity Market Summary — As of 9/18/26
European equities weakened as investors confronted the combination of higher oil prices, rising government bond yields and tighter global monetary policy. The STOXX Europe 600 declined 0.57%, Germany's DAX fell 1.03%, France's CAC 40 declined 1.40%, while the UK's FTSE 100 edged higher. Eurozone inflation accelerated to 3.2% y/y in August from 2.9%, with energy accounting for much of the increase, while core inflation was 2.4%. The Bank of England left rates unchanged at 3.75%, although three members favored an immediate hike.
Japanese equities were a notable outperformer. The Nikkei 225 rose 1.57% and the TOPIX gained 1.56%. The Bank of Japan raised its policy rate 25 bps to 1.25%, its highest level since 1995. The move was expected, but the 7–2 vote and relatively cautious forward guidance helped push the yen weaker rather than stronger; USD/JPY moved above 157 by the end of the week. Japan's core CPI eased to 1.7% y/y in August, while exports rose 19.3% y/y and imports jumped 28.0% as energy costs increased.
Chinese equities were mixed as the CSI 300 was marginally lower while the Shanghai Composite rose 0.61%. Technology shares recovered sharply late in the week, but economic data continued to highlight the divergence between resilient industrial production and weak domestic demand. August industrial production rose 5.2% y/y, while retail sales increased only 0.4% y/y and fixed-asset investment fell 7.2% through the first eight months of the year. New bank lending also came in well below expectations. Hong Kong underperformed, with the Hang Seng falling 0.22%.
| Region | 1 Wk | 1 Mo | 3 Mo | YTD | 1 Yr | 3 Yr | 5 Yr |
|---|---|---|---|---|---|---|---|
| MSCI ACWI | -0.49% | -0.76% | +1.25% | +13.55% | +18.14% | +20.97% | +11.50% |
| MSCI ACWI ex USA | -1.16% | -1.34% | -0.75% | +14.81% | +21.05% | +19.62% | +9.14% |
| MSCI Emerging Markets | -0.56% | +1.14% | -3.85% | +23.62% | +29.55% | +23.20% | +8.56% |
| MSCI Europe Stock | -1.86% | -3.58% | -0.25% | +7.05% | +14.12% | +17.01% | +9.15% |
| MSCI Asia Pacific Stock | -0.58% | +0.23% | -2.33% | +22.90% | +27.08% | +21.68% | +8.70% |
| MSCI Latin America Stock | -2.50% | +5.58% | +4.76% | +16.21% | +27.30% | +14.43% | +12.59% |
Chart of the Week — 9/21/26
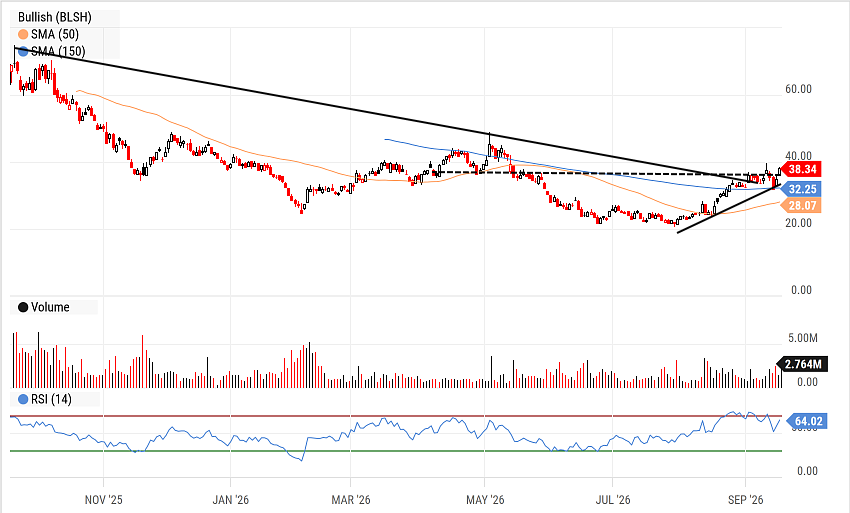
BLSH has been in a multi-year downtrend since coming public in August 2025 but now appears to be on the mend after having put in a bottom at $20. After a recent gap higher, BLSH has clearly moved above both its long term downtrend and a prior resistance level with an opportunity to take out its intermediate highs in the mid $40's, we like the setup.
The Week Ahead
With the Fed's September hike now behind us, a heavy calendar of Fed speakers will give investors their first opportunity to judge whether policymakers view the move as the beginning of a sustained hiking cycle or a more limited recalibration. The latest dot plot points to another hike before year end, while market pricing has begun assigning meaningful odds to an additional move as early as October.
Economic data are lighter than last week but still important. S&P Global flash manufacturing and services PMIs arrive Wednesday, offering an early look at September activity and price pressures. Initial jobless claims and August new home sales are due Thursday, followed Friday by August durable goods orders and final September University of Michigan consumer sentiment. New-home sales are particularly relevant as mortgage rates respond to the renewed increase in Treasury yields, while durable goods orders will provide another indication of whether business investment remains resilient. Regional Fed indices (Chicago, Richmond, Kansas City) will also provide some further insight into economic conditions around the U.S.
Markets will also monitor the scheduled Trump–Xi meeting on Thursday, where trade, tariffs, technology and broader U.S.-China relations will be on the agenda. The meeting could be relevant for technology, industrial and China-exposed companies, although the market impact is likely to be muted absent any concrete policy changes.
The consumer will also remain in focus through corporate earnings. AutoZone reports Tuesday; General Mills and Paychex Wednesday; and Darden Restaurants and Costco Thursday. Costco should offer a useful read on household spending and the impact of elevated fuel and other essential goods prices.
Oil enters the week near $100/barrel after falling from its recent highs, but supply routes through the Middle East remain vulnerable as the Houthis step up attacks on Saudi Arabia infrastructure. Any evidence of improved regional oil flows could ease inflation concerns and Treasury yields, while renewed disruption would likely produce the opposite response.
Internationally, attention will remain on the yen following the BoJ's rate increase and subsequent currency weakness. Japanese authorities have reportedly conducted rate checks as USD/JPY moved above 157, raising speculation about possible intervention. European and Asian flash PMIs will provide additional information on the global growth/inflation mix.
| Company | Date | EPS Est. |
|---|---|---|
| Abivax SA | Mon Sep 21 | ($0.76) |
| AutoZone, Inc. | Tue Sep 22 | $37.76 |
| Thor Industries, Inc. | Tue Sep 22 | $0.55 |
| KB Home | Tue Sep 22 | $1.48 |
| Worthington Enterprises, Inc. | Tue Sep 22 | $0.72 |
| Cracker Barrel Old Country Store | Wed Sep 23 | ($0.37) |
| Cintas Corp. | Wed Sep 23 | $1.35 |
| General Mills, Inc. | Wed Sep 23 | $0.98 |
| Paychex, Inc. | Wed Sep 23 | $1.36 |
| Darden Restaurants, Inc. | Thu Sep 24 | $2.29 |
| Costco Wholesale Corp. | Thu Sep 24 | $4.82 |
| Data Release | Date | Est. |
|---|---|---|
| Chicago Fed National Activity Index | Mon Sep 21 | 0.2 |
| Richmond Fed Manufacturing Index | Tue Sep 22 | 3.0 |
| US M2 Money Supply | Tue Sep 22 | N/A |
| S&P Global Composite Flash PMI | Wed Sep 23 | 55.2 |
| US New Single-Family Houses Sold | Thu Sep 24 | 626.0K |
| US Durable Goods New Orders MoM | Fri Sep 25 | -0.4% |
| US Index of Consumer Sentiment | Fri Sep 25 | 51.7 |
Key Interest Rates — As of 9/18/26
| Rate | As of | Latest | 1 Mo Ago | 1 Mo % | 1 Yr Ago | 1 Yr % |
|---|---|---|---|---|---|---|
| 1 Month Treasury | 9/18/26 | 3.97% | 3.78% | +5.0% | 4.20% | -5.5% |
| 2 Year Treasury | 9/18/26 | 4.76% | 4.19% | +13.6% | 3.57% | +33.3% |
| 10 Year Treasury | 9/18/26 | 5.01% | 4.71% | +6.4% | 4.11% | +21.9% |
| 30 Year Mortgage | 9/17/26 | 6.95% | 6.67% | +4.2% | 6.35% | +9.4% |
| US Corporate AAA | 9/17/26 | 5.47% | 5.34% | +2.4% | 4.55% | +20.2% |
| US Corporate BBB | 9/17/26 | 5.84% | 5.60% | +4.3% | 4.91% | +18.9% |
| US Corporate CCC | 9/17/26 | 15.45% | 14.43% | +7.1% | 11.70% | +32.1% |
| Effective Federal Funds | 9/17/26 | 3.88% | 3.63% | +6.9% | 4.33% | -10.4% |
US Economy Indicators
| Indicator | As of | Latest | 1 Mo Ago | 1 Mo % | 1 Yr Ago | 1 Yr % |
|---|---|---|---|---|---|---|
| Consumer Sentiment | 8/31/26 | 51.70 | 55.20 | -6.3% | 58.20 | -11.2% |
| Unemployment Rate | 8/31/26 | 4.10% | 4.10% | 0.0% | 4.30% | -4.7% |
| Inflation Rate | 8/31/26 | 3.40% | 3.40% | 0.0% | 2.90% | +17.2% |
| Manufacturing PMI | 8/31/26 | 54.60 | 55.60 | -1.8% | 48.70 | +12.1% |
| Non Manufacturing PMI | 8/31/26 | 55.40 | 54.10 | +2.4% | 52.00 | +6.5% |
| Retail Sales | 8/31/26 | 668,877 | 660,638 | +1.2% | 630,770 | +6.0% |
| Building Permits | 8/31/26 | 1,394 | 1,433 | -2.7% | 1,347 | +3.5% |
Suggested Readings
- 1Institute For The Study of War: Iran Update, September 18, 2026
- 2Is the AI Industry Really Ready to Slow Down?
- 3Transcript of Chairman Warsh's Press Conference, September 16, 2026
- 4Microsoft Exec Called AI Scraping the "Largest Theft of Labor in Human History"
- 5"China Shock 2.0" Fuels EU Push for United Response to Beijing
Leadership Insight
“Last month in Wyoming, I expressed my commitment to a monetary policy discipline, not to a decision. I defined the standard for action: We must be confident that underlying inflation is moving to our objective, clearly and at sufficient speed. Today, the FOMC decided that this standard has not been satisfied. The committee's unanimous vote shows our resolve to achieve price stability on a timelier basis. We aim to ensure that credit and financial conditions are consistent over time with our mandate, that relative price changes in some sectors of the economy do not broaden, that inflation compensation in market prices stays low, and that inflation expectations remain well-anchored.”
Stocks to Watch
For our full list of Stocks To Consider, contact Patrick Mullin at pmullin@timberpointcapital.com
U.S. equities were mixed as investors digested the Federal Reserve's first rate hike since 2023, another move above 5% in the 10-year Treasury yield, and continued volatility in oil prices. The SPX slipped 0.1%, the Dow fell 1.7%, and the R2K declined 1.5%, while strength in semiconductors and other technology shares helped the Nasdaq gain 0.7%. Market leadership remained narrow with healthcare (XLV) and technology (XLK) the strongest areas of the market, gaining roughly 1.6% and 1.0%, respectively, while utilities (XLU) fell nearly 3% and financials (XLF) declined more than 2%.
Technology stocks successfully absorbed a call for a slower pace of AI development owing to safety concerns from a number of industry leaders. Monday's reaction was sharp as the Philadelphia Semiconductor Index fell nearly 6%. However, the selloff was not uniform across technology as Alphabet and Meta actually rose. Investors returned aggressively to AI infrastructure names helping the Nasdaq gain 1.7% on Thursday as investors concluded that safeguards could be implemented without a significant spending slowdown.
The dominant macro development was the FOMC's unanimous 25 bps rate hike, which raised the federal funds target range to 3.75%–4.00%. Updated Fed projections indicated policymakers expect another 25 bps increase before year-end. The 10-year Treasury yield briefly reached 5.04%, its highest level since 2007, and finished the week near 5.01%, up from 4.96%. The 2-year yield rose more sharply, to roughly 4.76% from 4.63%.
Energy remained a major source of cross-asset volatility. WTI crude traded above $106 at one point as attacks on Saudi energy infrastructure raised concerns about supply through the region, before easing later in the week. WTI ultimately settled Friday near $100.30/barrel, up about 0.2% for the week, while Brent slipped roughly 0.7%.
Gold proved resilient despite the Fed hike and rising Treasury yields. Spot gold rose roughly 1% for the week to about $4,390/oz, snapping a three-week losing streak. Silver also strengthened, rising more than 3%.
| Asset Class | 1 Wk | 1 Mo | 3 Mo | YTD | 1 Yr | 3 Yr | 5 Yr |
|---|---|---|---|---|---|---|---|
| S&P 500 | -0.06% | -0.41% | +2.28% | +12.71% | +16.71% | +21.35% | +13.14% |
| Dow Jones Industrials Average | -1.69% | -2.85% | +0.61% | +8.82% | +13.83% | +16.32% | +10.43% |
| NASDAQ | +0.72% | +0.97% | +0.15% | +14.61% | +18.74% | +25.45% | +12.83% |
| S&P MidCap 400 | -1.71% | -5.18% | -3.42% | +11.46% | +11.82% | +14.18% | +8.04% |
| Russell 2000 | -1.50% | -5.10% | -3.71% | +16.22% | +17.34% | +17.54% | +6.50% |
| Russell Micro Cap | -0.72% | -4.32% | -1.44% | +20.73% | +26.99% | +24.17% | +6.88% |
| Sector | 1Wk | YTD |
|---|---|---|
| -1.71% | -6.65% | |
| -2.43% | +2.87% | |
| -1.88% | +11.13% | |
| -2.05% | +7.02% |
| Sector | 1Wk | YTD |
|---|---|---|
| -1.59% | -5.32% | |
| -1.27% | +45.80% | |
| -1.52% | +10.00% | |
| +1.03% | +32.01% |
| Sector | 1Wk | YTD |
|---|---|---|
| -0.70% | +7.94% | |
| +1.83% | +9.70% | |
| -3.04% | -2.44% |
| Style | 1 Wk | 1 Mo | 3 Mo | YTD | 1 Yr | 3 Yr | 5 Yr |
|---|---|---|---|---|---|---|---|
| Large Growth | +0.90% | +1.08% | +2.12% | +9.46% | +12.39% | +24.05% | +12.60% |
| Large Blend | -0.01% | -0.32% | +2.38% | +12.61% | +16.40% | +21.56% | +12.72% |
| Large Value | -1.21% | -2.21% | +2.72% | +17.13% | +21.64% | +18.19% | +12.56% |
| Mid Growth | -0.88% | -4.44% | -4.33% | +5.15% | +0.54% | +14.33% | +4.25% |
| Mid Blend | -1.29% | -3.74% | +0.16% | +11.07% | +11.17% | +15.90% | +7.25% |
| Mid Value | -1.58% | -3.21% | +3.73% | +15.24% | +19.21% | +16.65% | +9.81% |
| Small Growth | -0.74% | -5.60% | -5.17% | +12.25% | +11.31% | +15.81% | +3.59% |
| Small Blend | -1.34% | -4.58% | -2.12% | +13.00% | +13.21% | +15.73% | +6.87% |
| Small Value | -1.78% | -3.83% | +0.19% | +13.48% | +14.59% | +15.60% | +9.21% |
With the Fed's September hike now behind us, a heavy calendar of Fed speakers will give investors their first opportunity to judge whether policymakers view the move as the beginning of a sustained hiking cycle or a more limited recalibration. The latest dot plot points to another hike before year end, while market pricing has begun assigning meaningful odds to an additional move as early as October.
Economic data are lighter than last week but still important. S&P Global flash manufacturing and services PMIs arrive Wednesday, offering an early look at September activity and price pressures. Initial jobless claims and August new home sales are due Thursday, followed Friday by August durable goods orders and final September University of Michigan consumer sentiment.
Markets will also monitor the scheduled Trump–Xi meeting on Thursday, where trade, tariffs, technology and broader U.S.-China relations will be on the agenda. The meeting could be relevant for technology, industrial and China-exposed companies, although the market impact is likely to be muted absent any concrete policy changes.
The consumer will also remain in focus through corporate earnings. AutoZone reports Tuesday; General Mills and Paychex Wednesday; and Darden Restaurants and Costco Thursday. Costco should offer a useful read on household spending and the impact of elevated fuel and other essential goods prices.
Oil enters the week near $100/barrel after falling from its recent highs, but supply routes through the Middle East remain vulnerable as the Houthis step up attacks on Saudi Arabia infrastructure. Any evidence of improved regional oil flows could ease inflation concerns and Treasury yields, while renewed disruption would likely produce the opposite response.
Internationally, attention will remain on the yen following the BoJ's rate increase and subsequent currency weakness. Japanese authorities have reportedly conducted rate checks as USD/JPY moved above 157, raising speculation about possible intervention.
| Company | Date | EPS Est. |
|---|---|---|
| Abivax SA | Mon Sep 21 | ($0.76) |
| AutoZone, Inc. | Tue Sep 22 | $37.76 |
| Thor Industries, Inc. | Tue Sep 22 | $0.55 |
| KB Home | Tue Sep 22 | $1.48 |
| Worthington Enterprises, Inc. | Tue Sep 22 | $0.72 |
| Cracker Barrel Old Country Store | Wed Sep 23 | ($0.37) |
| Cintas Corp. | Wed Sep 23 | $1.35 |
| General Mills, Inc. | Wed Sep 23 | $0.98 |
| Paychex, Inc. | Wed Sep 23 | $1.36 |
| Darden Restaurants, Inc. | Thu Sep 24 | $2.29 |
| Costco Wholesale Corp. | Thu Sep 24 | $4.82 |
| Data Release | Date | Est. |
|---|---|---|
| Chicago Fed National Activity Index | Mon Sep 21 | 0.2 |
| Richmond Fed Manufacturing Index | Tue Sep 22 | 3.0 |
| US M2 Money Supply | Tue Sep 22 | N/A |
| S&P Global Composite Flash PMI | Wed Sep 23 | 55.2 |
| US New Single-Family Houses Sold | Thu Sep 24 | 626.0K |
| US Durable Goods New Orders MoM | Fri Sep 25 | -0.4% |
| US Index of Consumer Sentiment | Fri Sep 25 | 51.7 |
European equities weakened as investors confronted the combination of higher oil prices, rising government bond yields and tighter global monetary policy. The STOXX Europe 600 declined 0.57%, Germany's DAX fell 1.03%, France's CAC 40 declined 1.40%, while the UK's FTSE 100 edged higher. Eurozone inflation accelerated to 3.2% y/y in August from 2.9%, with energy accounting for much of the increase.
Japanese equities were a notable outperformer. The Nikkei 225 rose 1.57% and the TOPIX gained 1.56%. The Bank of Japan raised its policy rate 25 bps to 1.25%, its highest level since 1995. The move was expected, but the 7–2 vote and relatively cautious forward guidance helped push the yen weaker rather than stronger; USD/JPY moved above 157 by the end of the week.
Chinese equities were mixed as the CSI 300 was marginally lower while the Shanghai Composite rose 0.61%. August industrial production rose 5.2% y/y, while retail sales increased only 0.4% y/y. Hong Kong underperformed, with the Hang Seng falling 0.22%.
| Region | 1 Wk | 1 Mo | 3 Mo | YTD | 1 Yr | 3 Yr | 5 Yr |
|---|---|---|---|---|---|---|---|
| MSCI ACWI | -0.49% | -0.76% | +1.25% | +13.55% | +18.14% | +20.97% | +11.50% |
| MSCI ACWI ex USA | -1.16% | -1.34% | -0.75% | +14.81% | +21.05% | +19.62% | +9.14% |
| MSCI Emerging Markets | -0.56% | +1.14% | -3.85% | +23.62% | +29.55% | +23.20% | +8.56% |
| MSCI Europe Stock | -1.86% | -3.58% | -0.25% | +7.05% | +14.12% | +17.01% | +9.15% |
| MSCI Asia Pacific Stock | -0.58% | +0.23% | -2.33% | +22.90% | +27.08% | +21.68% | +8.70% |
| MSCI Latin America Stock | -2.50% | +5.58% | +4.76% | +16.21% | +27.30% | +14.43% | +12.59% |
| Rate | Latest | 1 Mo Ago | 1 Mo % | 1 Yr Ago | 1 Yr % |
|---|---|---|---|---|---|
| 1 Month Treasury | 3.97% | 3.78% | +5.0% | 4.20% | -5.5% |
| 2 Year Treasury | 4.76% | 4.19% | +13.6% | 3.57% | +33.3% |
| 10 Year Treasury | 5.01% | 4.71% | +6.4% | 4.11% | +21.9% |
| 30 Year Mortgage | 6.95% | 6.67% | +4.2% | 6.35% | +9.4% |
| US Corporate AAA | 5.47% | 5.34% | +2.4% | 4.55% | +20.2% |
| US Corporate BBB | 5.84% | 5.60% | +4.3% | 4.91% | +18.9% |
| US Corporate CCC | 15.45% | 14.43% | +7.1% | 11.70% | +32.1% |
| Effective Federal Funds | 3.88% | 3.63% | +6.9% | 4.33% | -10.4% |
| Indicator | Latest | 1 Mo Ago | 1 Mo % | 1 Yr Ago | 1 Yr % |
|---|---|---|---|---|---|
| Consumer Sentiment | 51.70 | 55.20 | -6.3% | 58.20 | -11.2% |
| Unemployment Rate | 4.10% | 4.10% | 0.0% | 4.30% | -4.7% |
| Inflation Rate | 3.40% | 3.40% | 0.0% | 2.90% | +17.2% |
| Manufacturing PMI | 54.60 | 55.60 | -1.8% | 48.70 | +12.1% |
| Non Manufacturing PMI | 55.40 | 54.10 | +2.4% | 52.00 | +6.5% |
| Retail Sales | 668,877 | 660,638 | +1.2% | 630,770 | +6.0% |
| Building Permits | 1,394 | 1,433 | -2.7% | 1,347 | +3.5% |
BLSH has been in a multi-year downtrend since coming public in August 2025 but now appears to be on the mend after having put in a bottom at $20. After a recent gap higher, BLSH has clearly moved above both its long term downtrend and a prior resistance level with an opportunity to take out its intermediate highs in the mid $40's, we like the setup.
“Last month in Wyoming, I expressed my commitment to a monetary policy discipline, not to a decision. I defined the standard for action: We must be confident that underlying inflation is moving to our objective, clearly and at sufficient speed. Today, the FOMC decided that this standard has not been satisfied. The committee's unanimous vote shows our resolve to achieve price stability on a timelier basis. We aim to ensure that credit and financial conditions are consistent over time with our mandate, that relative price changes in some sectors of the economy do not broaden, that inflation compensation in market prices stays low, and that inflation expectations remain well-anchored.”
For our full list of Stocks To Consider, contact Patrick Mullin at pmullin@timberpointcapital.com
©2020 YCharts, Inc. All Rights Reserved. YCharts, Inc. ("YCharts") is not registered with the U.S. Securities and Exchange Commission as an investment adviser, broker-dealer or in any other capacity, and does not purport to provide investment advice or make investment recommendations. This report has been generated through application of the analytical tools and data provided through ycharts.com and is intended solely to assist you or your investment or other adviser(s) in conducting investment research.
All data, statistics and charts are courtesy of YCharts unless otherwise noted. Investment Advice is offered through Fortis Capital Advisors, LLC, 7301 Mission Road, Suite 326, Prairie Village, KS 66208.
While reasonable efforts were used to obtain information from sources believed to be reliable, Fortis Capital Advisors, LLC makes no representation that the information or opinions contained in this material are accurate, reliable, or complete. All information and opinions are subject to change without notice. You should not construe this report as an offer to buy or sell, as a solicitation of an offer to buy or sell, or as a recommendation to buy, sell, hold or trade, any security or other financial instrument.
Past performance is not indicative of future results. Investing involves risk, including the possible loss of principal. The information contained herein is provided for informational purposes only and should not be construed as investment, tax, or legal advice. Recipients should consult their own advisers before making any investment decisions.
Source: Timber Point Capital Management. Powered by Fortis Capital Advisors. Investment Advice is offered through Fortis Capital Advisors, LLC, 7301 Mission Road, Suite 326, Prairie Village, KS 66208. All rights reserved.