
The Week That Was
U.S. equities finished the week higher despite a continued rise in Treasury yields amid ongoing concerns over elevated inflation and strong economic data. President Trump and President Xi met and agreed to extend the existing trade truce by two months, to early January 2027, allowing for further negotiations over tariffs, agricultural purchases and rare earths thereby reducing the near term risk of further trade tensions. For the week, the S&P 500 gained 1.2%, the Nasdaq Composite advanced 2.1%, and the Dow added 0.3%. Small caps did not participate in the rally, with the Russell 2K declining 0.8%, while the S&P MidCap 400 was essentially unchanged. Market leadership continued to be narrow with large-cap growth, up 2.4% on the week, returning to the leadership position as investors sought out “durable” growth stories in the secular AI buildout trade.
Technology (XLK) and communication services (XLC) led the advance, up 3.6% and 2.3% respectively, as excitement over Meta's rollout of its Muse AI agent provided investors with a tangible example of potential AI monetization. Semiconductor and infrastructure-related companies also benefited as investors focused on the computing capacity likely to be required by increasingly sophisticated and numerous AI agents. AI-related stocks have repeatedly absorbed negative headlines, concerns over spending, regulation and valuations, only to attract buyers again when evidence of adoption or monetization emerges. That strength has helped keep the capitalization-weighted S&P 500 near record levels, even as broader participation has weakened. Utilities (XLU) and Energy (XLE) were the big sector losers, both down ~3%, as higher fixed income yields and a potential thawing of tensions in the Iran war weighed on investor enthusiasm.
Economic data continued to show a resilient US economy. S&P Global's flash U.S. composite PMI increased to 58.4 in September from 58.0 in August, its highest level in more than five years. Services activity accelerated to 58.7, while manufacturing PMI rose sharply to 57.0 from 53.9. New orders and production were particularly strong. However, input costs also accelerated to their highest rate since October 2022, increasing concerns that stronger demand, and higher oil prices, could prolong inflation pressures. Initial jobless claims of 197K likewise remained consistent with a relatively firm labor market.
The bond market continued to demand higher yields as several Fed officials emphasized that inflation remains too high and that additional tightening may be necessary. The 10-year Treasury yield climbed above 5.2% during the week, while the 30-year yield moved above 5.5%, its highest level since 2004. Demand at both the five-year and seven-year Treasury auctions was weak, particularly from foreign buyers, reinforcing concerns about the amount of yield investors may require to absorb increased government issuance. Rising yields are partly a function of economic growth, a good outcome for equities, but also sticky inflation, expectations for additional Fed tightening and a lack of forward guidance from Fed Chair Warsh.
WTI crude fell below $93/barrel Friday morning after trading above $100 earlier in the month, as hopes for progress in the U.S.-Iran conflict and improving Middle East supply flows reduced fears of prolonged shortages. Lower oil prices helped Treasury yields retreat from their weekly highs on Friday, although any talks should be treated as tentative, at best. Gold declined ~3% amid rising Treasury yields, a stronger dollar and expectations for additional Fed tightening which reduces demand for the non-yielding metal.
U.S. Equity Market Summary — As of 9/25/26
| Asset Class | 1 Wk | 1 Mo | 3 Mo | YTD | 1 Yr | 3 Yr | 5 Yr |
|---|---|---|---|---|---|---|---|
| S&P 500 | +1.23% | +0.97% | +5.53% | +14.09% | +18.62% | +22.92% | +13.30% |
| Dow Jones Industrials Average | +0.28% | -3.10% | +0.20% | +9.13% | +14.64% | +17.13% | +10.36% |
| NASDAQ | +2.06% | +3.58% | +6.89% | +16.98% | +21.65% | +27.68% | +13.29% |
| S&P MidCap 400 | -0.06% | -3.87% | -4.24% | +11.41% | +14.32% | +14.98% | +7.86% |
| Russell 2000 | -0.80% | -5.61% | -5.37% | +15.31% | +19.14% | +18.32% | +6.22% |
| Russell Micro Cap | -0.77% | -5.27% | -2.36% | +19.82% | +28.33% | +24.95% | +6.60% |
U.S. Sector Summary — As of 9/25/26
| Cyclical Sectors | 1 Wk | 1 Mo | 3 Mo | YTD | 1 Yr | 3 Yr | 5 Yr |
|---|---|---|---|---|---|---|---|
| Consumer Cyclical | -0.21% | -6.06% | -2.25% | -6.84% | -5.63% | +11.86% | +4.51% |
| Financials | -1.48% | -5.62% | +2.96% | +1.34% | +4.17% | +19.40% | +9.34% |
| Materials | +0.08% | -6.63% | -3.49% | +11.22% | +15.45% | +10.11% | +6.28% |
| Real Estate | -1.47% | -7.61% | -6.02% | +5.45% | +3.72% | +10.07% | +1.41% |
| Sensitive Sectors | 1 Wk | 1 Mo | 3 Mo | YTD | 1 Yr | 3 Yr | 5 Yr |
|---|---|---|---|---|---|---|---|
| Comm. Services | +2.26% | +0.12% | +7.33% | -3.18% | -2.29% | +21.13% | +7.63% |
| Energy | -2.94% | +0.58% | +15.40% | +41.51% | +39.99% | +14.67% | +23.75% |
| Industrials | +0.67% | -4.21% | -7.19% | +10.74% | +13.98% | +20.20% | +12.73% |
| Technology | +3.64% | +8.12% | +6.46% | +36.81% | +41.92% | +34.35% | +21.05% |
| Defensive Sectors | 1 Wk | 1 Mo | 3 Mo | YTD | 1 Yr | 3 Yr | 5 Yr |
|---|---|---|---|---|---|---|---|
| Consumer Defensive | -0.24% | -4.53% | -1.59% | +7.68% | +8.42% | +8.39% | +5.80% |
| Health Care | +1.76% | -2.25% | +10.10% | +11.63% | +29.38% | +11.09% | +7.00% |
| Utilities | -3.16% | -8.10% | -13.19% | -5.52% | -4.86% | +10.98% | +7.10% |
US Equity Style Summary — As of 9/25/26
| Equity Style | 1 Wk | 1 Mo | 3 Mo | YTD | 1 Yr | 3 Yr | 5 Yr |
|---|---|---|---|---|---|---|---|
| Large Growth | +2.41% | +4.06% | +9.73% | +12.10% | +15.54% | +26.43% | +13.03% |
| Large Blend | +1.26% | +1.16% | +5.84% | +14.03% | +18.34% | +23.15% | +12.89% |
| Large Value | -0.24% | -2.64% | +0.66% | +16.85% | +21.88% | +18.82% | +12.39% |
| Mid Growth | +1.62% | -2.13% | -1.63% | +6.85% | +3.76% | +16.03% | +4.42% |
| Mid Blend | -0.01% | -3.37% | -0.44% | +11.06% | +12.25% | +16.85% | +7.09% |
| Mid Value | -1.16% | -4.24% | +0.52% | +13.91% | +18.47% | +17.02% | +9.41% |
| Small Growth | +0.89% | -4.07% | -4.47% | +13.25% | +15.87% | +17.54% | +3.71% |
| Small Blend | +0.07% | -4.42% | -3.03% | +13.07% | +16.29% | +16.84% | +6.73% |
| Small Value | -0.55% | -4.70% | -1.98% | +12.85% | +16.52% | +16.24% | +8.86% |
International Equity Market Summary — As of 9/25/26
European equities advanced modestly despite many of the same bond-market pressures affecting U.S. investors. The STOXX Europe 600 rose 0.5%, Germany's DAX gained 0.4%, France's CAC 40 advanced 0.2%, and the UK's FTSE 100 gained 0.3%. Improving economic data helped offset concerns over energy prices and the possibility of tighter monetary policy. Eurozone business activity strengthened more than expected, with the September composite PMI rising to 53.1 from 52.0. German activity improved and French business activity returned to expansion for the first time in 10 months. However, input costs and selling prices increased at their fastest pace in four months, creating the same growth-versus-inflation tension confronting policymakers in the U.S. German business confidence also improved for a fifth consecutive month, although consumer sentiment remained weak.
Japanese equities were higher as the Nikkei 225 gained 2.1% and the TOPIX rose 0.9% despite trading for only two sessions because of national holidays. AI and semiconductor-related shares led the advance as Japanese markets caught up with strength in U.S. technology stocks, while banks benefited from higher domestic bond yields. Japanese government bond yields continued to rise, with the 10-year JGB yield reaching approximately 3.09% from 2.99% the prior week. The yen weakened beyond 158 per USD before rebounding Friday as investors remained alert to possible government intervention. The Bank of Japan's recent rate increase has not prevented yen weakness, and officials continue to signal concern about excessive currency depreciation.
Chinese equities were lower as the CSI 300 fell 1.5% and the Shanghai Composite declined 0.6% through Thursday before mainland markets closed Friday for the Mid-Autumn Festival. Growth and technology shares weakened as higher global yields, elevated oil prices and only limited progress from the U.S.-China summit weighed on sentiment. The extension of the U.S.-China trade truce through January offered some near-term stability, but significant disagreements remain over agricultural purchases, rare earths, technology restrictions and other trade commitments. The summit reduced immediate tail risk without materially changing the longer-term competitive relationship between the two countries. Hong Kong's Hang Seng fell 1%.
| Region | 1 Wk | 1 Mo | 3 Mo | YTD | 1 Yr | 3 Yr | 5 Yr |
|---|---|---|---|---|---|---|---|
| MSCI ACWI | +0.94% | 0.00% | +3.96% | +14.63% | +19.95% | +22.38% | +11.69% |
| MSCI ACWI ex USA | +0.47% | -1.68% | +0.96% | +15.35% | +22.61% | +20.74% | +9.35% |
| MSCI Emerging Markets | +1.29% | +1.83% | -0.77% | +25.22% | +31.39% | +24.52% | +9.07% |
| MSCI Europe Stock | +0.09% | -4.88% | +0.25% | +7.14% | +16.12% | +17.95% | +9.12% |
| MSCI Asia Pacific Stock | +1.20% | +1.66% | +0.65% | +24.38% | +29.11% | +23.12% | +9.23% |
| MSCI Latin America Stock | -1.07% | -0.99% | +4.61% | +14.97% | +26.01% | +15.40% | +12.35% |
Chart of the Week — 9/28/26
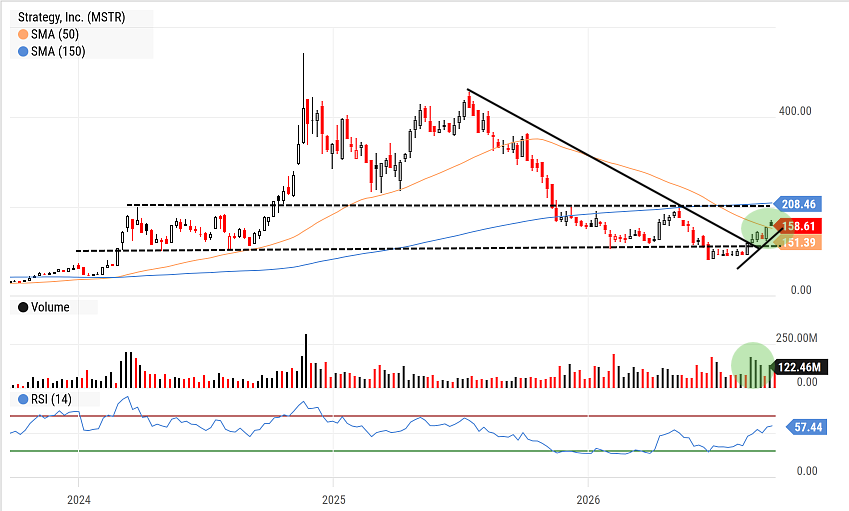
MSTR has been in a downtrend since mid '25 when it was trading a bit over $450. Roughly one year later, MSTR found a bottom near $100 and most recently has gapped higher on strong volume above the $150 level. MSTR still needs to prove it can move through the top end of its channel near $200 but we believe a test of that level will occur which provides ~30% upside over the intermediate term.
The Week Ahead
A big week of economic data lies ahead with investors receiving fresh information on inflation, employment, manufacturing and economic growth. After the bond market's sharp reaction to stronger September business activity, it appears data is now being evaluated through the lens of whether it adds to or subtracts from the likelihood of further Fed rate increases. This reaction function will be compounded by a healthy number of Fed officials speaking and putting their own spin on future Fed rate actions.
Tuesday brings the August JOLTS report which has remained steady and strong, averaging above 7M openings for 2026, which has given Chair Warsh the leeway to hike rates as he characterizes the US labor markets as “broadly stable”. Friday's September non-farm employment report will test that characterization as it will provide the most recent update on labor conditions since the Fed resumed raising rates. August's report of 162K was much better than expected, after a few weak-ish months, and September's estimate of 90K appears to be neither too hot nor too cold to move fixed income or equity markets one way or the other.
The Fed's preferred inflation measure, the PCE index, reports on Wednesday with recent readings in the high 3% range uncomfortably high for a Fed focused on returning to 2% inflation, but are largely a function of higher energy prices. The Core PCE, which rose 3.3% y/y in July, also remains elevated relative to the high 2% range it ran for most of 2H25. Expectations are for both measures to increase marginally from last month's prints.
Thursday's September ISM manufacturing data and final S&P Global manufacturing PMI will provide investors with another look at the improvement in the factory sector. Construction spending is also scheduled for release. Given that the S&P Global flash manufacturing PMI jumped sharply last week, investors are expecting continued confirmation that manufacturing activity remains strong.
Corporate earnings will provide important insight for the AI and consumer narratives. Micron (MU) reports Wednesday after the close, with commentary likely focused on memory pricing, data-center demand and AI infrastructure capex that will have broader implications for technology leadership. Accenture (ACN) and Nike (NKE) report Thursday, while Carnival (CCL), CarMax (KMX) and Jabil (JBL) are also scheduled during the week.
The central question for markets remains further equity market advances in the face of persistent inflation and rising bond yields that will continue to act as a drag on market valuations. Large-cap technology stocks have so far been able to overcome the rise in rates because earnings expectations and enthusiasm around AI remain strong. But with the 10-year Treasury yield firmly above 5% and market breadth relatively narrow, the tolerance for disappointing economic, inflation or earnings news may be lower than an SPX only a few percent off recent highs may suggest.
| Company | Date | EPS Est. |
|---|---|---|
| Jefferies Financial Group, Inc. | Mon Sep 28 | $0.91 |
| Vail Resorts, Inc. | Mon Sep 28 | ($5.39) |
| Carnival Corp. Ltd. | Tue Sep 29 | $0.24 |
| CarMax, Inc. | Tue Sep 29 | $0.40 |
| Uranium Energy Corp. | Tue Sep 29 | ($0.01) |
| AAR Corp. | Tue Sep 29 | $1.36 |
| Conagra Brands, Inc. | Wed Sep 30 | $0.41 |
| FactSet Research Systems, Inc. | Wed Sep 30 | $4.94 |
| Jabil, Inc. | Wed Sep 30 | $3.65 |
| Micron Technology, Inc. | Wed Sep 30 | $35.58 |
| Accenture Plc | Thu Oct 1 | $3.99 |
| NIKE, Inc. | Thu Oct 1 | $0.54 |
| Data Release | Date | Est. |
|---|---|---|
| Case-Shiller Composite 20 Home Price Index YoY | Tue Sep 29 | 2.0% |
| US Job Openings: Total Nonfarm (JOLTS) | Tue Sep 29 | 7.24M |
| Conference Board Consumer Confidence | Tue Sep 29 | 89.0 |
| US PCE Price Index YoY | Wed Sep 30 | 3.8% |
| ADP Employment Change | Wed Sep 30 | 49.0K |
| US Real GDP YoY | Wed Sep 30 | 2.2% |
| US ISM Manufacturing PMI | Thu Oct 1 | 54.7 |
| US Total Nonfarm Payrolls | Fri Oct 2 | 90.0K |
Key Interest Rates — As of 9/25/26
| Rate | As of | Latest | 1 Mo Ago | 1 Mo % | 1 Yr Ago | 1 Yr % |
|---|---|---|---|---|---|---|
| 1 Month Treasury | 9/25/26 | 4.04% | 3.79% | +6.6% | 4.24% | -4.7% |
| 2 Year Treasury | 9/25/26 | 4.81% | 4.17% | +15.3% | 3.64% | +32.1% |
| 10 Year Treasury | 9/25/26 | 5.17% | 4.64% | +11.4% | 4.18% | +23.7% |
| 30 Year Mortgage | 9/24/26 | 7.03% | 6.65% | +5.7% | 6.26% | +12.3% |
| US Corporate AAA | 9/24/26 | 5.70% | 5.31% | +7.3% | 4.62% | +23.4% |
| US Corporate BBB | 9/24/26 | 6.08% | 5.60% | +8.6% | 4.97% | +22.3% |
| US Corporate CCC | 9/24/26 | 16.04% | 14.65% | +9.5% | 11.63% | +37.9% |
| Effective Federal Funds | 9/24/26 | 3.88% | 3.63% | +6.9% | 4.09% | -5.1% |
US Economy Indicators
| Indicator | As of | Latest | 1 Mo Ago | 1 Mo % | 1 Yr Ago | 1 Yr % |
|---|---|---|---|---|---|---|
| Consumer Sentiment | 8/31/26 | 51.70 | 55.20 | -6.3% | 58.20 | -11.2% |
| Unemployment Rate | 8/31/26 | 4.10% | 4.10% | 0.0% | 4.30% | -4.7% |
| Inflation Rate | 8/31/26 | 3.40% | 3.40% | 0.0% | 2.90% | +17.2% |
| Manufacturing PMI | 8/31/26 | 54.60 | 55.60 | -1.8% | 48.70 | +12.1% |
| Non Manufacturing PMI | 8/31/26 | 55.40 | 54.10 | +2.4% | 52.00 | +6.5% |
| Retail Sales | 8/31/26 | 668,877 | 660,638 | +1.2% | 630,770 | +6.0% |
| Building Permits | 8/31/26 | 1,394 | 1,433 | -2.7% | 1,347 | +3.5% |
Suggested Readings
- 1Institute For The Study of War: The Russian Military Campaign Against Europe: Current Objectives and Efforts
- 2Meta's Muse is Outpacing ChatGPT's Early Mobile Launch
- 3Why Beijing Isn't Taking the Bait With Trump
- 4US Being Left Behind in EV Charging Speeds as China Goes Sub 5 Minutes to 70%
- 5Tesla Close to Making 1K Optimus Humanoids a Week, But Robots Struggle With Tasks
Leadership Insight
“So what we're seeing overall currently, if I add together the sort of the cumulative impact in all of our merchandising categories, we feel like inflation currently is running in the low-single digits, and it's relatively stable overall from what we've seen in prior quarters. The area where we did see some increase in the current quarter was in nonfoods. And that was really — I won't say it was isolated, but the vast majority of it was within memory costs on consumer electronics and the items that you would expect to be related to oil.”
Stocks to Watch
For our full list of Stocks To Consider, contact Patrick Mullin at pmullin@timberpointcapital.com
U.S. equities finished the week higher despite a continued rise in Treasury yields amid ongoing concerns over elevated inflation and strong economic data. President Trump and President Xi met and agreed to extend the existing trade truce by two months, to early January 2027, allowing for further negotiations over tariffs, agricultural purchases and rare earths thereby reducing the near term risk of further trade tensions. For the week, the S&P 500 gained 1.2%, the Nasdaq Composite advanced 2.1%, and the Dow added 0.3%. Small caps did not participate in the rally, with the Russell 2K declining 0.8%, while the S&P MidCap 400 was essentially unchanged.
Technology (XLK) and communication services (XLC) led the advance, up 3.6% and 2.3% respectively, as excitement over Meta's rollout of its Muse AI agent provided investors with a tangible example of potential AI monetization. Semiconductor and infrastructure-related companies also benefited as investors focused on the computing capacity likely to be required by increasingly sophisticated and numerous AI agents. Utilities (XLU) and Energy (XLE) were the big sector losers, both down ~3%, as higher fixed income yields and a potential thawing of tensions in the Iran war weighed on investor enthusiasm.
Economic data continued to show a resilient US economy. S&P Global's flash U.S. composite PMI increased to 58.4 in September from 58.0 in August, its highest level in more than five years. Services activity accelerated to 58.7, while manufacturing PMI rose sharply to 57.0 from 53.9. However, input costs also accelerated to their highest rate since October 2022, increasing concerns that stronger demand, and higher oil prices, could prolong inflation pressures.
The bond market continued to demand higher yields as several Fed officials emphasized that inflation remains too high and that additional tightening may be necessary. The 10-year Treasury yield climbed above 5.2% during the week, while the 30-year yield moved above 5.5%, its highest level since 2004. Demand at both the five-year and seven-year Treasury auctions was weak, particularly from foreign buyers.
WTI crude fell below $93/barrel Friday morning after trading above $100 earlier in the month, as hopes for progress in the U.S.-Iran conflict reduced fears of prolonged shortages. Gold declined ~3% amid rising Treasury yields, a stronger dollar and expectations for additional Fed tightening.
| Asset Class | 1 Wk | 1 Mo | 3 Mo | YTD | 1 Yr | 3 Yr | 5 Yr |
|---|---|---|---|---|---|---|---|
| S&P 500 | +1.23% | +0.97% | +5.53% | +14.09% | +18.62% | +22.92% | +13.30% |
| Dow Jones Industrials Average | +0.28% | -3.10% | +0.20% | +9.13% | +14.64% | +17.13% | +10.36% |
| NASDAQ | +2.06% | +3.58% | +6.89% | +16.98% | +21.65% | +27.68% | +13.29% |
| S&P MidCap 400 | -0.06% | -3.87% | -4.24% | +11.41% | +14.32% | +14.98% | +7.86% |
| Russell 2000 | -0.80% | -5.61% | -5.37% | +15.31% | +19.14% | +18.32% | +6.22% |
| Russell Micro Cap | -0.77% | -5.27% | -2.36% | +19.82% | +28.33% | +24.95% | +6.60% |
| Sector | 1Wk | YTD |
|---|---|---|
| -0.21% | -6.84% | |
| -1.48% | +1.34% | |
| +0.08% | +11.22% | |
| -1.47% | +5.45% |
| Sector | 1Wk | YTD |
|---|---|---|
| +2.26% | -3.18% | |
| -2.94% | +41.51% | |
| +0.67% | +10.74% | |
| +3.64% | +36.81% |
| Sector | 1Wk | YTD |
|---|---|---|
| -0.24% | +7.68% | |
| +1.76% | +11.63% | |
| -3.16% | -5.52% |
| Style | 1 Wk | 1 Mo | 3 Mo | YTD | 1 Yr | 3 Yr | 5 Yr |
|---|---|---|---|---|---|---|---|
| Large Growth | +2.41% | +4.06% | +9.73% | +12.10% | +15.54% | +26.43% | +13.03% |
| Large Blend | +1.26% | +1.16% | +5.84% | +14.03% | +18.34% | +23.15% | +12.89% |
| Large Value | -0.24% | -2.64% | +0.66% | +16.85% | +21.88% | +18.82% | +12.39% |
| Mid Growth | +1.62% | -2.13% | -1.63% | +6.85% | +3.76% | +16.03% | +4.42% |
| Mid Blend | -0.01% | -3.37% | -0.44% | +11.06% | +12.25% | +16.85% | +7.09% |
| Mid Value | -1.16% | -4.24% | +0.52% | +13.91% | +18.47% | +17.02% | +9.41% |
| Small Growth | +0.89% | -4.07% | -4.47% | +13.25% | +15.87% | +17.54% | +3.71% |
| Small Blend | +0.07% | -4.42% | -3.03% | +13.07% | +16.29% | +16.84% | +6.73% |
| Small Value | -0.55% | -4.70% | -1.98% | +12.85% | +16.52% | +16.24% | +8.86% |
A big week of economic data lies ahead with investors receiving fresh information on inflation, employment, manufacturing and economic growth. After the bond market's sharp reaction to stronger September business activity, it appears data is now being evaluated through the lens of whether it adds to or subtracts from the likelihood of further Fed rate increases.
Tuesday brings the August JOLTS report which has remained steady and strong, averaging above 7M openings for 2026, which has given Chair Warsh the leeway to hike rates as he characterizes the US labor markets as “broadly stable”. Friday's September non-farm employment report will test that characterization. August's report of 162K was much better than expected, and September's estimate of 90K appears to be neither too hot nor too cold.
The Fed's preferred inflation measure, the PCE index, reports on Wednesday with recent readings in the high 3% range uncomfortably high for a Fed focused on returning to 2% inflation. Expectations are for both measures to increase marginally from last month's prints.
Thursday's September ISM manufacturing data and final S&P Global manufacturing PMI will provide investors with another look at the improvement in the factory sector. Given that the S&P Global flash manufacturing PMI jumped sharply last week, investors are expecting continued confirmation that manufacturing activity remains strong.
Corporate earnings will provide important insight for the AI and consumer narratives. Micron (MU) reports Wednesday after the close, with commentary likely focused on memory pricing, data-center demand and AI infrastructure capex. Accenture (ACN) and Nike (NKE) report Thursday, while Carnival (CCL), CarMax (KMX) and Jabil (JBL) are also scheduled during the week.
| Company | Date | EPS Est. |
|---|---|---|
| Jefferies Financial Group, Inc. | Mon Sep 28 | $0.91 |
| Vail Resorts, Inc. | Mon Sep 28 | ($5.39) |
| Carnival Corp. Ltd. | Tue Sep 29 | $0.24 |
| CarMax, Inc. | Tue Sep 29 | $0.40 |
| Uranium Energy Corp. | Tue Sep 29 | ($0.01) |
| AAR Corp. | Tue Sep 29 | $1.36 |
| Conagra Brands, Inc. | Wed Sep 30 | $0.41 |
| FactSet Research Systems, Inc. | Wed Sep 30 | $4.94 |
| Jabil, Inc. | Wed Sep 30 | $3.65 |
| Micron Technology, Inc. | Wed Sep 30 | $35.58 |
| Accenture Plc | Thu Oct 1 | $3.99 |
| NIKE, Inc. | Thu Oct 1 | $0.54 |
| Data Release | Date | Est. |
|---|---|---|
| Case-Shiller Composite 20 Home Price Index YoY | Tue Sep 29 | 2.0% |
| US Job Openings: Total Nonfarm (JOLTS) | Tue Sep 29 | 7.24M |
| Conference Board Consumer Confidence | Tue Sep 29 | 89.0 |
| US PCE Price Index YoY | Wed Sep 30 | 3.8% |
| ADP Employment Change | Wed Sep 30 | 49.0K |
| US Real GDP YoY | Wed Sep 30 | 2.2% |
| US ISM Manufacturing PMI | Thu Oct 1 | 54.7 |
| US Total Nonfarm Payrolls | Fri Oct 2 | 90.0K |
European equities advanced modestly despite many of the same bond-market pressures affecting U.S. investors. The STOXX Europe 600 rose 0.5%, Germany's DAX gained 0.4%, France's CAC 40 advanced 0.2%, and the UK's FTSE 100 gained 0.3%. Eurozone business activity strengthened more than expected, with the September composite PMI rising to 53.1 from 52.0. German activity improved and French business activity returned to expansion for the first time in 10 months. However, input costs and selling prices increased at their fastest pace in four months.
Japanese equities were higher as the Nikkei 225 gained 2.1% and the TOPIX rose 0.9% despite trading for only two sessions because of national holidays. AI and semiconductor-related shares led the advance. Japanese government bond yields continued to rise, with the 10-year JGB yield reaching approximately 3.09%. The yen weakened beyond 158 per USD before rebounding Friday as investors remained alert to possible government intervention.
Chinese equities were lower as the CSI 300 fell 1.5% and the Shanghai Composite declined 0.6% through Thursday before mainland markets closed Friday for the Mid-Autumn Festival. The extension of the U.S.-China trade truce through January offered some near-term stability, but significant disagreements remain. Hong Kong's Hang Seng fell 1%.
| Region | 1 Wk | 1 Mo | 3 Mo | YTD | 1 Yr | 3 Yr | 5 Yr |
|---|---|---|---|---|---|---|---|
| MSCI ACWI | +0.94% | 0.00% | +3.96% | +14.63% | +19.95% | +22.38% | +11.69% |
| MSCI ACWI ex USA | +0.47% | -1.68% | +0.96% | +15.35% | +22.61% | +20.74% | +9.35% |
| MSCI Emerging Markets | +1.29% | +1.83% | -0.77% | +25.22% | +31.39% | +24.52% | +9.07% |
| MSCI Europe Stock | +0.09% | -4.88% | +0.25% | +7.14% | +16.12% | +17.95% | +9.12% |
| MSCI Asia Pacific Stock | +1.20% | +1.66% | +0.65% | +24.38% | +29.11% | +23.12% | +9.23% |
| MSCI Latin America Stock | -1.07% | -0.99% | +4.61% | +14.97% | +26.01% | +15.40% | +12.35% |
| Rate | Latest | 1 Mo Ago | 1 Mo % | 1 Yr Ago | 1 Yr % |
|---|---|---|---|---|---|
| 1 Month Treasury | 4.04% | 3.79% | +6.6% | 4.24% | -4.7% |
| 2 Year Treasury | 4.81% | 4.17% | +15.3% | 3.64% | +32.1% |
| 10 Year Treasury | 5.17% | 4.64% | +11.4% | 4.18% | +23.7% |
| 30 Year Mortgage | 7.03% | 6.65% | +5.7% | 6.26% | +12.3% |
| US Corporate AAA | 5.70% | 5.31% | +7.3% | 4.62% | +23.4% |
| US Corporate BBB | 6.08% | 5.60% | +8.6% | 4.97% | +22.3% |
| US Corporate CCC | 16.04% | 14.65% | +9.5% | 11.63% | +37.9% |
| Effective Federal Funds | 3.88% | 3.63% | +6.9% | 4.09% | -5.1% |
| Indicator | Latest | 1 Mo Ago | 1 Mo % | 1 Yr Ago | 1 Yr % |
|---|---|---|---|---|---|
| Consumer Sentiment | 51.70 | 55.20 | -6.3% | 58.20 | -11.2% |
| Unemployment Rate | 4.10% | 4.10% | 0.0% | 4.30% | -4.7% |
| Inflation Rate | 3.40% | 3.40% | 0.0% | 2.90% | +17.2% |
| Manufacturing PMI | 54.60 | 55.60 | -1.8% | 48.70 | +12.1% |
| Non Manufacturing PMI | 55.40 | 54.10 | +2.4% | 52.00 | +6.5% |
| Retail Sales | 668,877 | 660,638 | +1.2% | 630,770 | +6.0% |
| Building Permits | 1,394 | 1,433 | -2.7% | 1,347 | +3.5% |
MSTR has been in a downtrend since mid '25 when it was trading a bit over $450. Roughly one year later, MSTR found a bottom near $100 and most recently has gapped higher on strong volume above the $150 level. MSTR still needs to prove it can move through the top end of its channel near $200 but we believe a test of that level will occur which provides ~30% upside over the intermediate term.
“So what we're seeing overall currently, if I add together the sort of the cumulative impact in all of our merchandising categories, we feel like inflation currently is running in the low-single digits, and it's relatively stable overall from what we've seen in prior quarters. The area where we did see some increase in the current quarter was in nonfoods. And that was really — I won't say it was isolated, but the vast majority of it was within memory costs on consumer electronics and the items that you would expect to be related to oil.”
For our full list of Stocks To Consider, contact Patrick Mullin at pmullin@timberpointcapital.com
©2020 YCharts, Inc. All Rights Reserved. YCharts, Inc. ("YCharts") is not registered with the U.S. Securities and Exchange Commission as an investment adviser, broker-dealer or in any other capacity, and does not purport to provide investment advice or make investment recommendations. This report has been generated through application of the analytical tools and data provided through ycharts.com and is intended solely to assist you or your investment or other adviser(s) in conducting investment research.
All data, statistics and charts are courtesy of YCharts unless otherwise noted. Investment Advice is offered through Fortis Capital Advisors, LLC, 7301 Mission Road, Suite 326, Prairie Village, KS 66208.
While reasonable efforts were used to obtain information from sources believed to be reliable, Fortis Capital Advisors, LLC makes no representation that the information or opinions contained in this material are accurate, reliable, or complete. All information and opinions are subject to change without notice. You should not construe this report as an offer to buy or sell, as a solicitation of an offer to buy or sell, or as a recommendation to buy, sell, hold or trade, any security or other financial instrument.
Past performance is not indicative of future results. Investing involves risk, including the possible loss of principal. The information contained herein is provided for informational purposes only and should not be construed as investment, tax, or legal advice. Recipients should consult their own advisers before making any investment decisions.
Source: Timber Point Capital Management. Powered by Fortis Capital Advisors. Investment Advice is offered through Fortis Capital Advisors, LLC, 7301 Mission Road, Suite 326, Prairie Village, KS 66208. All rights reserved.