The Week That Was
The nine-week winning streak for major equity indices ended as AI momentum cooled, oil prices rose, and Treasury yields moved higher after stronger-than-expected labor data. The Nasdaq led declines, falling roughly 4.7%, followed by the Russell 2000 and S&P 500, down 2.9% and 2.6%, respectively, while the DJIA held up best with only a 0.3% decline.
AI optimism faded later in the week as investors reassessed stretched expectations for AI-adjacent companies, which was compounded by an $80B equity raise by GOOGL and strong, but somewhat less than hoped for, AVGO earnings guidance.
Labor market data were largely supportive of a still strong economy as nonfarm payrolls rose 172K in May, well above expectations near 80K, March and April payrolls were revised higher and the unemployment rate was unchanged at 4.3%. ADP private payrolls increased 122K, better than estimated, and April job openings jumped to 7.62M, the highest level in nearly two years. Initial claims rose to 225K, while continuing claims eased to 1.78M.
Business activity remained firm as ISM manufacturing rose to 54.0, the strongest reading in four years, while ISM services improved to 54.5 and new orders strengthened. Price data inside both surveys stayed elevated, with the services prices index reaching its highest level since August 2022 and manufacturing prices still signaling rising input costs. The Fed Beige Book similarly pointed to increased activity in most districts alongside moderate-to-strong price increases.
Treasury yields rose on the stronger economic data with the 10-year rising to 4.55% on Friday from 4.44% the prior week, while the two-year yield rose to 4.15%, with market odds for an October hike rising. Oil rose 3.2% as geopolitical tensions in the Persian Gulf and renewed U.S.-Iran uncertainty kept the supply-risk premium in focus. Gold fell 4.8% and silver declined 9.5% as rate-hike speculation weighed on precious metals. The USD index rallied back near 100 into the weekend as higher yields supported the greenback.
U.S. Equity Market Summary — As of 6/5/26
| Asset Class | 1 Wk | 1 Mo | 3 Mo | YTD | 1 Yr | 3 Yr | 5 Yr |
|---|---|---|---|---|---|---|---|
| S&P 500 | -2.55% | 1.86% | 8.44% | 8.43% | 25.86% | 21.63% | 13.41% |
| Dow Jones Industrials | -0.32% | 3.45% | 6.54% | 6.63% | 22.23% | 16.98% | 9.99% |
| NASDAQ | -4.68% | 1.61% | 13.23% | 10.92% | 34.06% | 25.66% | 14.06% |
| S&P MidCap 400 | -0.85% | 0.95% | 6.10% | 12.35% | 23.99% | 15.97% | 7.89% |
| Russell 2000 | -2.94% | -0.28% | 9.94% | 14.71% | 36.83% | 17.80% | 5.82% |
| Russell Micro Cap | -5.07% | -2.18% | 9.74% | 15.43% | 50.94% | 20.98% | 5.10% |
U.S. Sector Summary — As of 6/5/26
| Cyclical Sectors | 1 Wk | 1 Mo | 3 Mo | YTD | 1 Yr | 3 Yr | 5 Yr |
|---|---|---|---|---|---|---|---|
| Consumer Cyclical | -4.97% | -2.72% | -1.26% | -3.62% | 10.53% | 14.33% | 6.94% |
| Financials | 1.40% | 1.38% | 2.61% | -4.02% | 4.84% | 18.92% | 8.20% |
| Materials | -1.02% | -1.75% | 0.04% | 12.13% | 17.90% | 11.00% | 4.93% |
| Real Estate | 1.61% | 1.20% | 3.83% | 11.52% | 10.73% | 10.58% | 3.41% |
| Sensitive Sectors | 1 Wk | 1 Mo | 3 Mo | YTD | 1 Yr | 3 Yr | 5 Yr |
|---|---|---|---|---|---|---|---|
| Comm. Services | -3.47% | -3.42% | -5.42% | -4.84% | 10.40% | 22.14% | 8.20% |
| Energy | 2.45% | -2.99% | 2.77% | 29.82% | 45.41% | 17.00% | 19.98% |
| Industrials | 0.61% | 1.03% | 1.51% | 12.60% | 22.81% | 22.02% | 12.27% |
| Technology | -5.61% | 8.86% | 28.78% | 25.39% | 53.57% | 30.42% | 21.75% |
| Defensive Sectors | 1 Wk | 1 Mo | 3 Mo | YTD | 1 Yr | 3 Yr | 5 Yr |
|---|---|---|---|---|---|---|---|
| Consumer Defensive | 0.64% | -0.74% | -1.76% | 8.02% | 5.30% | 7.27% | 5.87% |
| Health Care | 2.37% | 5.31% | -0.18% | -0.75% | 17.00% | 7.13% | 6.31% |
| Utilities | -0.16% | -4.36% | -4.78% | 4.61% | 12.83% | 14.10% | 9.55% |
US Equity Style Summary — As of 6/5/26
| Equity Style | 1 Wk | 1 Mo | 3 Mo | YTD | 1 Yr | 3 Yr | 5 Yr |
|---|---|---|---|---|---|---|---|
| Large Growth | -4.12% | 1.89% | 11.10% | 5.76% | 23.94% | 24.58% | 14.35% |
| Large Blend | -2.51% | 2.00% | 8.65% | 8.19% | 25.47% | 21.84% | 13.05% |
| Large Value | 0.06% | 2.63% | 5.33% | 11.60% | 26.37% | 18.14% | 11.10% |
| Mid Growth | -1.83% | 1.40% | 6.45% | 5.27% | 8.26% | 15.24% | 6.31% |
| Mid Blend | -0.52% | 1.10% | 4.92% | 8.67% | 17.19% | 16.29% | 7.61% |
| Mid Value | 0.51% | 0.86% | 3.68% | 10.85% | 23.70% | 16.71% | 8.49% |
| Small Growth | -3.74% | 0.12% | 9.31% | 13.49% | 27.87% | 16.60% | 4.94% |
| Small Blend | -1.76% | 0.60% | 6.73% | 12.22% | 26.89% | 16.73% | 6.71% |
| Small Value | -0.19% | 0.96% | 4.84% | 11.28% | 26.13% | 16.80% | 7.90% |
International Equity Market Summary — As of 6/5/26
Global unrest in the form of marginally higher oil prices, renewed US tariff concerns, ongoing Middle East military maneuvers and fading technology momentum weighed on investor sentiment resulting in mixed equity prices. The STOXX Europe 600 was down 0.5%, led by Germany's DAX decline of 1.4% while the FTSE 100 was lower by 0.4%. France's CAC 40 rose 0.4%. Final GDP growth estimates for the eurozone showed a contraction of 0.2% in 1Q26, a downward revision from the initial 0.1% growth estimate, led by Ireland's 12.1% decline. Eurozone retail sales fell 0.4% m/m in April, led by nonfood products, while French industrial production edged up 0.1% m/m, a bit better than expected. U.K. new car sales rose 7.1% y/y in May, the strongest May since 2019, as EV demand surged.
Japan was mixed, with the Nikkei 225 up 0.4% while the TOPIX fell 0.2%. BoJ Governor Ueda's comments were interpreted as raising the likelihood of a June rate hike, as he emphasized vigilance toward upside inflation risks even while acknowledging downside risks to activity. Wage data were firmer, with nominal wages up 3.5% y/y and real wages positive for a fourth straight month, while household spending remained weak. The 10-year JGB yield was little changed at 2.66%, and the yen weakened toward JPY 160 versus USD.
China equities declined as the CSI 300 fell 1.5% and the Shanghai Composite declined 1.0%. Official manufacturing PMI eased to 50.0 from 50.3, signaling stalled momentum, while the private RatingDog manufacturing PMI held in expansion at 51.8, pointing to better conditions among smaller and private firms. AI commercialization remained a bright spot, with Tencent testing a WeChat AI agent and DeepSeek reportedly exploring a funding round that could value the company near $52B. The Hang Seng declined 0.9%.
| Region | 1 Wk | 1 Mo | 3 Mo | YTD | 1 Yr | 3 Yr | 5 Yr |
|---|---|---|---|---|---|---|---|
| MSCI ACWI | -2.21% | 2.23% | 8.26% | 9.92% | 26.87% | 20.92% | 11.31% |
| MSCI ACWI ex USA | -1.59% | 2.67% | 7.50% | 12.54% | 28.86% | 19.01% | 8.23% |
| MSCI Emerging Markets | -1.94% | 4.39% | 14.90% | 23.18% | 47.99% | 23.13% | 7.03% |
| MSCI Europe | -1.36% | 1.68% | 4.30% | 5.36% | 16.45% | 16.25% | 8.51% |
| MSCI Asia Pacific | -1.44% | 4.88% | 12.58% | 21.11% | 41.11% | 21.28% | 7.82% |
| MSCI Latin America | -4.60% | -9.11% | -3.54% | 7.97% | 34.23% | 13.17% | 8.17% |
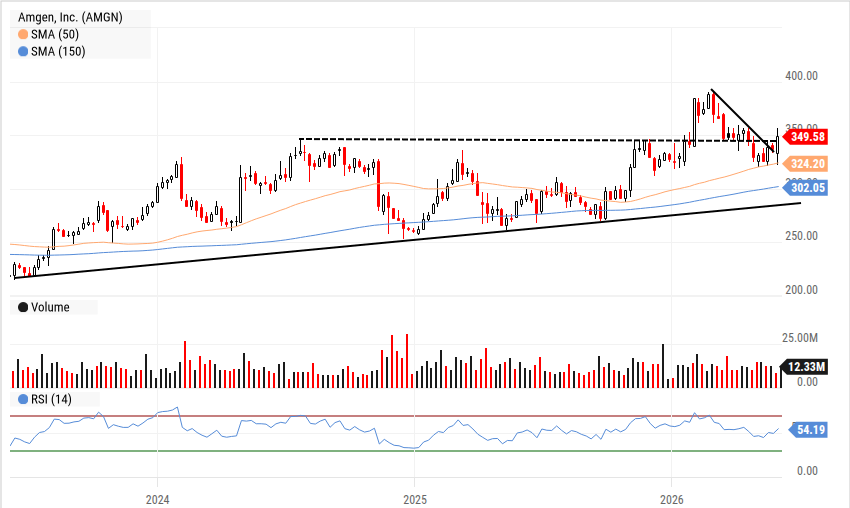
Chart of the Week — 6/8/26
The XLV broke above its 150 dma late last week which has us searching for rebounding healthcare names. AMGN is in a long term uptrend, has broken a near term downtrend and moved above intermediate resistance. We like the setup.
The Week Ahead
To Infinity, and Beyond…as SpaceX blasts off into public markets this week hoping to raise $75B at an ~$1.75T valuation. Fears of a big capital suck from SpaceX and others orbiting closely behind it (Anthropic, OpenAI, Databricks), in addition to GOOGL's $80B equity raise and META's rumored raise, gave tech investors indigestion last week — as did higher 2-year rates warning of a possible rate hike.
This week's earnings results will largely focus on consumer related names (CPB, MTN, SJM, CASY, CHWY) with the backdrop of the XLY (Cons Disc sector SPDR) and RSPD (Equal Weight Cons Disc) both having broken their 50/150 dma's on Friday. Granted, AMZN remains firmly above its 150dma but MCD, HD, BKNG all signal some level of distress across various consumer sectors despite robust employment data last week, along with positive prior month revisions.
ORCL and ADBE will be the focus for tech investors with ORCL having showed a strong revenue acceleration last quarter that put to rest, somewhat, fears of dependence on OpenAI and a stretched balance sheet. ADBE will hope to dispel the belief that they are a melting ice cube in the face of greater AI capabilities.
Price indices including the CPI and PPI (Wed/Thur) will show accelerating inflation prints as energy and logistics prices spike input costs that are slowly bleeding into finished good prices. April energy costs jumped 18%, the steepest annual increase since Sept. '02, but WTI crude has largely been flat over the past month, suggesting the m/m print will be subdued. PPI prices rose 6% y/y in April and are expected to rise further in May, approaching 7%.
We will also be watching the size of the Fed Balance Sheet on Thursday as new Fed Chair Warsh begins his term with meetings next week.
| Company | Date | EPS Est. |
|---|---|---|
| The Campbell's Co. (CPB) | Mon Jun 8 | $0.41 |
| Vail Resorts, Inc. (MTN) | Mon Jun 8 | ($5.00) |
| SailPoint, Inc. (SAIL) | Tue Jun 9 | $0.08 |
| The J. M. Smucker Co. (SJM) | Tue Jun 9 | $2.18 |
| Casey's General Stores, Inc. (CASY) | Tue Jun 9 | $6.45 |
| Chewy, Inc. (CHWY) | Wed Jun 10 | $0.40 |
| Core & Main, Inc. (CNM) | Wed Jun 10 | $0.78 |
| Oracle Corp. (ORCL) | Wed Jun 10 | $1.68 |
| Adobe Systems Inc. (ADBE) | Thu Jun 11 | $5.81 |
| Lennar Corp. (LEN) | Thu Jun 11 | $1.74 |
| RH | Thu Jun 11 | $2.11 |
| Replimune Group, Inc. (REPL) | Fri Jun 12 | ($0.60) |
| Data Release | Date | Est. |
|---|---|---|
| US Consumer Inflation Expectations | Mon Jun 8 | 3.8% |
| NFIB Business Optimism Index | Tue Jun 9 | 95.7 |
| US Trade Balance on Goods & Services | Tue Jun 9 | -$57.9B |
| US Existing Home Sales | Tue Jun 9 | 4.04M |
| US Consumer Price Index YoY | Wed Jun 10 | 4.0% |
| US Producer Price Index YoY | Thu Jun 11 | 6.8% |
| Fed Balance Sheet | Thu Jun 11 | N/A |
| US Index of Consumer Sentiment | Fri Jun 12 | 46.0 |
| US Oil Rig Count | Fri Jun 12 | N/A |
Key Interest Rates — As of 6/5/26
| Rate | As of | Latest | 1 Mo Ago | 1 Mo % | 1 Yr Ago | 1 Yr % |
|---|---|---|---|---|---|---|
| 1 Month Treasury | 6/5/26 | 3.71% | 3.70% | 0.3% | 4.26% | -12.9% |
| 2 Year Treasury | 6/5/26 | 4.17% | 3.93% | 6.1% | 3.92% | 6.4% |
| 10 Year Treasury | 6/5/26 | 4.55% | 4.43% | 2.7% | 4.40% | 3.4% |
| 30 Year Mortgage | 6/4/26 | 6.48% | 6.30% | 2.9% | 6.89% | -6.0% |
| US Corporate AAA | 6/4/26 | 5.00% | 5.03% | -0.6% | 4.85% | 3.1% |
| US Corporate BBB | 6/4/26 | 5.34% | 5.36% | -0.4% | 5.38% | -0.7% |
| US Corporate CCC | 6/4/26 | 13.61% | 13.16% | 3.4% | 13.22% | 3.0% |
| Effective Fed Funds | 6/3/26 | 3.62% | 3.64% | -0.5% | 4.33% | -16.4% |
US Economy Indicators
| Indicator | As of | Latest | 1 Mo Ago | 1 Mo % | 1 Yr Ago | 1 Yr % |
|---|---|---|---|---|---|---|
| Consumer Sentiment | 5/31/26 | 44.80 | 49.80 | -10.0% | 52.20 | -14.2% |
| Unemployment Rate | 5/31/26 | 4.30% | 4.30% | 0.0% | 4.30% | 0.0% |
| Inflation Rate (CPI YoY) | 4/30/26 | 3.80% | 2.40% | 58.3% | 2.30% | 65.2% |
| Manufacturing PMI | 5/31/26 | 54.00 | 52.70 | 2.5% | 48.50 | 11.3% |
| Non-Manufacturing PMI | 4/30/26 | 53.60 | 56.10 | -4.5% | 51.60 | 3.9% |
| Retail Sales ($M) | 4/30/26 | 656,115 | 641,038 | 2.4% | 623,635 | 5.2% |
| Building Permits (K) | 4/30/26 | 1,442 | 1,540 | -6.4% | 1,445 | -0.2% |
Suggested Readings
- 1Institute for the Study of War: Iran Update Special Report, June 7, 2026
- 2When AI Builds Itself: Anthropic's Progress Toward Recursive Self-Improvement, and Its Implications
- 3Trafigura: 2026 Half Year Review — Marketplace Review of Energy Markets
- 4America's Largest Banks Are Building a New Digital Currency Network to Stop a Massive Deposit Drain
- 5Is Berkshire Hathaway's $6.8B Taylor Morrison Acquisition a Genius Move or a Risky Bet?
Leadership Insight
“…in April 2026, Claude shipped over 800 fixes that reduced a class of API errors by a factor of one thousand. The engineer overseeing Claude estimated that a human would have taken four years to complete this work; solving other people's bugs is slow and painstaking, and humans struggle to hold that much unfamiliar context in their head at once.”
Stocks to Watch
For our full list of Stocks To Watch, contact Patrick Mullin at pmullin@timberpointcapital.com
The nine-week winning streak for major equity indices ended as AI momentum cooled, oil prices rose, and Treasury yields moved higher after stronger-than-expected labor data. The Nasdaq led declines, falling roughly 4.7%, followed by the Russell 2000 and S&P 500, down 2.9% and 2.6%, respectively, while the DJIA held up best with only a 0.3% decline.
AI optimism faded later in the week as investors reassessed stretched expectations for AI-adjacent companies, which was compounded by an $80B equity raise by GOOGL and strong, but somewhat less than hoped for, AVGO earnings guidance.
Labor market data were largely supportive of a still strong economy as nonfarm payrolls rose 172K in May, well above expectations near 80K, March and April payrolls were revised higher and the unemployment rate was unchanged at 4.3%. ADP private payrolls increased 122K, better than estimated, and April job openings jumped to 7.62M, the highest level in nearly two years. Initial claims rose to 225K, while continuing claims eased to 1.78M.
Business activity remained firm as ISM manufacturing rose to 54.0, the strongest reading in four years, while ISM services improved to 54.5 and new orders strengthened. Price data inside both surveys stayed elevated, with the services prices index reaching its highest level since August 2022 and manufacturing prices still signaling rising input costs. The Fed Beige Book similarly pointed to increased activity in most districts alongside moderate-to-strong price increases.
Treasury yields rose on the stronger economic data with the 10-year rising to 4.55% on Friday from 4.44% the prior week, while the two-year yield rose to 4.15%, with market odds for an October hike rising. Oil rose 3.2% as geopolitical tensions in the Persian Gulf and renewed U.S.-Iran uncertainty kept the supply-risk premium in focus. Gold fell 4.8% and silver declined 9.5% as rate-hike speculation weighed on precious metals. The USD index rallied back near 100 into the weekend as higher yields supported the greenback.
| Asset Class | 1 Wk | 1 Mo | 3 Mo | YTD | 1 Yr | 3 Yr | 5 Yr |
|---|---|---|---|---|---|---|---|
| S&P 500 | -2.55% | 1.86% | 8.44% | 8.43% | 25.86% | 21.63% | 13.41% |
| Dow Jones Industrials | -0.32% | 3.45% | 6.54% | 6.63% | 22.23% | 16.98% | 9.99% |
| NASDAQ | -4.68% | 1.61% | 13.23% | 10.92% | 34.06% | 25.66% | 14.06% |
| S&P MidCap 400 | -0.85% | 0.95% | 6.10% | 12.35% | 23.99% | 15.97% | 7.89% |
| Russell 2000 | -2.94% | -0.28% | 9.94% | 14.71% | 36.83% | 17.80% | 5.82% |
| Russell Micro Cap | -5.07% | -2.18% | 9.74% | 15.43% | 50.94% | 20.98% | 5.10% |
| Sector | 1Wk | YTD |
|---|---|---|
| -4.97% | -3.62% | |
| 1.40% | -4.02% | |
| -1.02% | 12.13% | |
| 1.61% | 11.52% |
| Sector | 1Wk | YTD |
|---|---|---|
| -3.47% | -4.84% | |
| 2.45% | 29.82% | |
| 0.61% | 12.60% | |
| -5.61% | 25.39% |
| Sector | 1Wk | YTD |
|---|---|---|
| 0.64% | 8.02% | |
| 2.37% | -0.75% | |
| -0.16% | 4.61% |
| Style | 1 Wk | 1 Mo | 3 Mo | YTD | 1 Yr | 3 Yr | 5 Yr |
|---|---|---|---|---|---|---|---|
| Large Growth | -4.12% | 1.89% | 11.10% | 5.76% | 23.94% | 24.58% | 14.35% |
| Large Blend | -2.51% | 2.00% | 8.65% | 8.19% | 25.47% | 21.84% | 13.05% |
| Large Value | 0.06% | 2.63% | 5.33% | 11.60% | 26.37% | 18.14% | 11.10% |
| Mid Growth | -1.83% | 1.40% | 6.45% | 5.27% | 8.26% | 15.24% | 6.31% |
| Mid Blend | -0.52% | 1.10% | 4.92% | 8.67% | 17.19% | 16.29% | 7.61% |
| Mid Value | 0.51% | 0.86% | 3.68% | 10.85% | 23.70% | 16.71% | 8.49% |
| Small Growth | -3.74% | 0.12% | 9.31% | 13.49% | 27.87% | 16.60% | 4.94% |
| Small Blend | -1.76% | 0.60% | 6.73% | 12.22% | 26.89% | 16.73% | 6.71% |
| Small Value | -0.19% | 0.96% | 4.84% | 11.28% | 26.13% | 16.80% | 7.90% |
To Infinity, and Beyond…as SpaceX blasts off into public markets this week hoping to raise $75B at an ~$1.75T valuation. Fears of a big capital suck from SpaceX and others orbiting closely behind it (Anthropic, OpenAI, Databricks), in addition to GOOGL's $80B equity raise and META's rumored raise, gave tech investors indigestion last week — as did higher 2-year rates warning of a possible rate hike.
This week's earnings results will largely focus on consumer related names (CPB, MTN, SJM, CASY, CHWY) with the backdrop of the XLY (Cons Disc sector SPDR) and RSPD (Equal Weight Cons Disc) both having broken their 50/150 dma's on Friday. Granted, AMZN remains firmly above its 150dma but MCD, HD, BKNG all signal some level of distress across various consumer sectors despite robust employment data last week, along with positive prior month revisions.
ORCL and ADBE will be the focus for tech investors with ORCL having showed a strong revenue acceleration last quarter that put to rest, somewhat, fears of dependence on OpenAI and a stretched balance sheet. ADBE will hope to dispel the belief that they are a melting ice cube in the face of greater AI capabilities.
Price indices including the CPI and PPI (Wed/Thur) will show accelerating inflation prints as energy and logistics prices spike input costs that are slowly bleeding into finished good prices. April energy costs jumped 18%, the steepest annual increase since Sept. '02, but WTI crude has largely been flat over the past month, suggesting the m/m print will be subdued. PPI prices rose 6% y/y in April and are expected to rise further in May, approaching 7%.
We will also be watching the size of the Fed Balance Sheet on Thursday as new Fed Chair Warsh begins his term with meetings next week.
| Company | Date | EPS Est. |
|---|---|---|
| The Campbell's Co. (CPB) | Mon Jun 8 | $0.41 |
| Vail Resorts, Inc. (MTN) | Mon Jun 8 | ($5.00) |
| SailPoint, Inc. (SAIL) | Tue Jun 9 | $0.08 |
| The J. M. Smucker Co. (SJM) | Tue Jun 9 | $2.18 |
| Casey's General Stores, Inc. (CASY) | Tue Jun 9 | $6.45 |
| Chewy, Inc. (CHWY) | Wed Jun 10 | $0.40 |
| Core & Main, Inc. (CNM) | Wed Jun 10 | $0.78 |
| Oracle Corp. (ORCL) | Wed Jun 10 | $1.68 |
| Adobe Systems Inc. (ADBE) | Thu Jun 11 | $5.81 |
| Lennar Corp. (LEN) | Thu Jun 11 | $1.74 |
| RH | Thu Jun 11 | $2.11 |
| Replimune Group, Inc. (REPL) | Fri Jun 12 | ($0.60) |
| Data Release | Date | Est. |
|---|---|---|
| US Consumer Inflation Expectations | Mon Jun 8 | 3.8% |
| NFIB Business Optimism Index | Tue Jun 9 | 95.7 |
| US Trade Balance on Goods & Services | Tue Jun 9 | -$57.9B |
| US Existing Home Sales | Tue Jun 9 | 4.04M |
| US Consumer Price Index YoY | Wed Jun 10 | 4.0% |
| US Producer Price Index YoY | Thu Jun 11 | 6.8% |
| Fed Balance Sheet | Thu Jun 11 | N/A |
| US Index of Consumer Sentiment | Fri Jun 12 | 46.0 |
| US Oil Rig Count | Fri Jun 12 | N/A |
Global unrest in the form of marginally higher oil prices, renewed US tariff concerns, ongoing Middle East military maneuvers and fading technology momentum weighed on investor sentiment resulting in mixed equity prices. The STOXX Europe 600 was down 0.5%, led by Germany's DAX decline of 1.4% while the FTSE 100 was lower by 0.4%. France's CAC 40 rose 0.4%. Final GDP growth estimates for the eurozone showed a contraction of 0.2% in 1Q26, a downward revision from the initial 0.1% growth estimate, led by Ireland's 12.1% decline. Eurozone retail sales fell 0.4% m/m in April, led by nonfood products, while French industrial production edged up 0.1% m/m, a bit better than expected. U.K. new car sales rose 7.1% y/y in May, the strongest May since 2019, as EV demand surged.
Japan was mixed, with the Nikkei 225 up 0.4% while the TOPIX fell 0.2%. BoJ Governor Ueda's comments were interpreted as raising the likelihood of a June rate hike, as he emphasized vigilance toward upside inflation risks even while acknowledging downside risks to activity. Wage data were firmer, with nominal wages up 3.5% y/y and real wages positive for a fourth straight month, while household spending remained weak. The 10-year JGB yield was little changed at 2.66%, and the yen weakened toward JPY 160 versus USD.
China equities declined as the CSI 300 fell 1.5% and the Shanghai Composite declined 1.0%. Official manufacturing PMI eased to 50.0 from 50.3, signaling stalled momentum, while the private RatingDog manufacturing PMI held in expansion at 51.8, pointing to better conditions among smaller and private firms. AI commercialization remained a bright spot, with Tencent testing a WeChat AI agent and DeepSeek reportedly exploring a funding round that could value the company near $52B. The Hang Seng declined 0.9%.
| Region | 1 Wk | 1 Mo | 3 Mo | YTD | 1 Yr | 3 Yr | 5 Yr |
|---|---|---|---|---|---|---|---|
| MSCI ACWI | -2.21% | 2.23% | 8.26% | 9.92% | 26.87% | 20.92% | 11.31% |
| MSCI ACWI ex USA | -1.59% | 2.67% | 7.50% | 12.54% | 28.86% | 19.01% | 8.23% |
| MSCI Emerging Markets | -1.94% | 4.39% | 14.90% | 23.18% | 47.99% | 23.13% | 7.03% |
| MSCI Europe | -1.36% | 1.68% | 4.30% | 5.36% | 16.45% | 16.25% | 8.51% |
| MSCI Asia Pacific | -1.44% | 4.88% | 12.58% | 21.11% | 41.11% | 21.28% | 7.82% |
| MSCI Latin America | -4.60% | -9.11% | -3.54% | 7.97% | 34.23% | 13.17% | 8.17% |
| Rate | Latest | 1 Mo Ago | 1 Mo % | 1 Yr Ago | 1 Yr % |
|---|---|---|---|---|---|
| 1 Month Treasury | 3.71% | 3.70% | 0.3% | 4.26% | -12.9% |
| 2 Year Treasury | 4.17% | 3.93% | 6.1% | 3.92% | 6.4% |
| 10 Year Treasury | 4.55% | 4.43% | 2.7% | 4.40% | 3.4% |
| 30 Year Mortgage | 6.48% | 6.30% | 2.9% | 6.89% | -6.0% |
| US Corporate AAA | 5.00% | 5.03% | -0.6% | 4.85% | 3.1% |
| US Corporate BBB | 5.34% | 5.36% | -0.4% | 5.38% | -0.7% |
| US Corporate CCC | 13.61% | 13.16% | 3.4% | 13.22% | 3.0% |
| Effective Fed Funds | 3.62% | 3.64% | -0.5% | 4.33% | -16.4% |
| Indicator | Latest | 1 Mo Ago | 1 Mo % | 1 Yr Ago | 1 Yr % |
|---|---|---|---|---|---|
| Consumer Sentiment | 44.80 | 49.80 | -10.0% | 52.20 | -14.2% |
| Unemployment Rate | 4.30% | 4.30% | 0.0% | 4.30% | 0.0% |
| Inflation Rate (CPI YoY) | 3.80% | 2.40% | 58.3% | 2.30% | 65.2% |
| Manufacturing PMI | 54.00 | 52.70 | 2.5% | 48.50 | 11.3% |
| Non-Manufacturing PMI | 53.60 | 56.10 | -4.5% | 51.60 | 3.9% |
| Retail Sales ($M) | 656,115 | 641,038 | 2.4% | 623,635 | 5.2% |
| Building Permits (K) | 1,442 | 1,540 | -6.4% | 1,445 | -0.2% |
The XLV broke above its 150 dma late last week which has us searching for rebounding healthcare names. AMGN is in a long term uptrend, has broken a near term downtrend and moved above intermediate resistance. We like the setup.
“…in April 2026, Claude shipped over 800 fixes that reduced a class of API errors by a factor of one thousand. The engineer overseeing Claude estimated that a human would have taken four years to complete this work; solving other people's bugs is slow and painstaking, and humans struggle to hold that much unfamiliar context in their head at once.”
For our full list of Stocks To Watch, contact Patrick Mullin at pmullin@timberpointcapital.com
©2020 YCharts, Inc. All Rights Reserved. YCharts, Inc. ("YCharts") is not registered with the U.S. Securities and Exchange Commission as an investment adviser, broker-dealer or in any other capacity, and does not purport to provide investment advice or make investment recommendations. This report has been generated through application of the analytical tools and data provided through ycharts.com and is intended solely to assist you or your investment or other adviser(s) in conducting investment research.
All data, statistics and charts are courtesy of YCharts unless otherwise noted. Investment Advice is offered through Fortis Capital Advisors, LLC, 7301 Mission Road, Suite 326, Prairie Village, KS 66208.
While reasonable efforts were used to obtain information from sources believed to be reliable, Fortis Capital Advisors, LLC makes no representation that the information or opinions contained in this material are accurate, reliable, or complete. All information and opinions are subject to change without notice. You should not construe this report as an offer to buy or sell, as a solicitation of an offer to buy or sell, or as a recommendation to buy, sell, hold or trade, any security or other financial instrument.
Past performance is not indicative of future results. Investing involves risk, including the possible loss of principal. The information contained herein is provided for informational purposes only and should not be construed as investment, tax, or legal advice. Recipients should consult their own advisers before making any investment decisions.
Source: Timber Point Capital Management. Powered by Fortis Capital Advisors. Investment Advice is offered through Fortis Capital Advisors, LLC, 7301 Mission Road, Suite 326, Prairie Village, KS 66208. All rights reserved.