
The Week That Was
U.S. equities were mixed as investors balanced a weak September employment report against ongoing inflation concerns and elevated oil prices which continued to push long-term Treasury yields higher. The S&P 500 slipped 0.3%, the Dow declined 1.3% and the Russell 2000 was essentially flat, while the Nasdaq Composite gained 0.5% and the S&P MidCap 400 rose 0.5%. Friday's rally following the employment report helped erase some of the week's earlier losses as investors took the news to mean that the Fed would be unlikely to hike rates further at its next meeting in October.
Sector performance was narrow as 8 of 11 SPX sectors were in the red with recent strength in the Technology sector (XLK), up 1.8% this week, to buoy the market cap weighted SPX. Energy (XLE) also gained, up 1.3%, on renewed fears of Iran war tensions and Utilities (XLU) gained 0.8% after having experienced steep losses over four of the past five weeks. Large-cap growth continued to outperform the broader market, reinforcing the importance of technology and AI-related companies to index-level returns, especially the Nasdaq which reached record territory during the week aided by a better than expected revenue outlook from Micron. Investors have continued to show a willingness to look through concerns about high valuations and financing costs when companies can demonstrate tangible exposure to the AI capital-spending cycle.
Friday's September employment report showed a meaningful slowdown in hiring as nonfarm payrolls increased just 29K, well below expectations of approximately 90K, while the unemployment rate ticked up to 4.2% from 4.1%. July and August payroll growth was also revised down by a combined 60,000 jobs. The report substantially reduced expectations for another Fed hike at the October meeting on the belief that the labor market is slowing rather than collapsing and the Fed would be loathe to act in front of the early November mid-term elections.
Additional labor indicators painted a similar picture as JOLTS job openings fell to 7.08 million from a revised 7.34 million in July, while consumer perceptions of labor market conditions weakened to their lowest level in more than five years. At the same time, weekly initial jobless claims remained below 200K, indicating that employers are not in a hurry to shed workers, suggesting that a broad deterioration in existing employment is not in the offing.
Inflation data also provided some relief for investors as the PCE price index increased 0.3% m/m in August and 3.4% y/y, while core PCE rose 0.2% m/m and 3.0% y/y. Both readings were softer than markets had feared and helped reduce the urgency for another immediate Fed hike, although both headline and core inflation remain well above the Fed's 2% target.
Q2 real GDP growth was revised up sharply to a 2.2% annualized rate from the earlier 1.5% estimate. Consumer spending grew 3.8%, while business investment remained strong, helped in part by continued investment in AI infrastructure and equipment. Real final sales to private domestic purchasers increased at a 4.6% annualized pace, suggesting that underlying domestic demand was considerably stronger than the headline GDP number alone indicated. The September ISM Manufacturing PMI registered 54.5, marking the ninth consecutive month of expansion. New orders and employment improved, but the prices paid index jumped to 77.9 from 71.1, its highest level since May. The economy therefore continues to send conflicting signals — hiring is slowing, but demand remains reasonably strong while input-price pressures remain elevated.
The 10-year Treasury yield reached approximately 5.34% during the week, its highest level in roughly 24 years, before easing after the employment report. Rising yields have reflected several forces at once: persistent inflation, stronger-than-expected underlying economic growth, heavy Treasury issuance, concerns about federal deficits and extraordinary capital requirements associated with the AI infrastructure buildout.
Brent crude traded above $108/barrel as hopes for progress in the U.S.-Iran conflict faded but increased crude shipments through the Strait of Hormuz improved and governments moved to release additional reserves. Diesel prices continued to move higher prompting the EU to begin to release their strategic reserves. Gold struggled amid higher real yields, falling roughly 3.4% for the week to around $4,140/oz.
U.S. Equity Market Summary — As of 10/2/26
| Asset Class | 1 Wk | 1 Mo | 3 Mo | YTD | 1 Yr | 3 Yr | 5 Yr |
|---|---|---|---|---|---|---|---|
| S&P 500 | -0.25% | +0.84% | +3.48% | +13.81% | +16.35% | +23.27% | +13.74% |
| Dow Jones Industrials Average | -1.26% | -3.46% | -2.91% | +7.76% | +11.81% | +17.30% | +10.38% |
| NASDAQ | +0.45% | +3.78% | +5.41% | +17.52% | +19.74% | +27.75% | +14.13% |
| S&P MidCap 400 | +0.53% | -1.94% | -3.23% | +12.09% | +13.40% | +15.83% | +8.11% |
| Russell 2000 | -0.16% | -3.94% | -5.15% | +15.18% | +16.65% | +18.86% | +6.25% |
| Russell Micro Cap | -0.47% | -3.81% | -5.34% | +19.31% | +25.60% | +25.39% | +6.43% |
U.S. Sector Summary — As of 10/2/26
| Cyclical Sectors | 1 Wk | 1 Mo | 3 Mo | YTD | 1 Yr | 3 Yr | 5 Yr |
|---|---|---|---|---|---|---|---|
| Consumer Cyclical | -0.47% | -3.99% | -5.84% | -7.28% | -7.32% | +11.87% | +4.88% |
| Financials | -2.46% | -6.91% | -3.49% | -1.15% | +1.83% | +19.42% | +8.84% |
| Materials | -1.89% | -7.30% | -5.62% | +9.12% | +10.88% | +10.11% | +6.06% |
| Real Estate | -1.80% | -5.90% | -7.90% | +3.55% | +0.78% | +10.55% | +1.48% |
| Sensitive Sectors | 1 Wk | 1 Mo | 3 Mo | YTD | 1 Yr | 3 Yr | 5 Yr |
|---|---|---|---|---|---|---|---|
| Comm. Services | -2.34% | -1.56% | +0.98% | -5.44% | -4.10% | +20.01% | +7.38% |
| Energy | +1.26% | -2.91% | +18.76% | +43.29% | +46.10% | +15.94% | +22.68% |
| Industrials | -0.28% | -1.37% | -7.34% | +10.43% | +11.46% | +20.85% | +13.05% |
| Technology | +1.80% | +8.95% | +10.77% | +39.28% | +40.36% | +34.95% | +22.29% |
| Defensive Sectors | 1 Wk | 1 Mo | 3 Mo | YTD | 1 Yr | 3 Yr | 5 Yr |
|---|---|---|---|---|---|---|---|
| Consumer Defensive | -1.86% | -5.22% | -4.62% | +5.67% | +6.17% | +8.52% | +5.89% |
| Health Care | -2.65% | -3.55% | +1.88% | +8.68% | +17.98% | +10.76% | +7.19% |
| Utilities | +0.81% | -5.97% | -12.32% | -4.76% | -6.79% | +15.72% | +7.69% |
US Equity Style Summary — As of 10/2/26
| Equity Style | 1 Wk | 1 Mo | 3 Mo | YTD | 1 Yr | 3 Yr | 5 Yr |
|---|---|---|---|---|---|---|---|
| Large Growth | +0.33% | +4.18% | +6.60% | +12.47% | +13.72% | +26.50% | +13.92% |
| Large Blend | -0.27% | +1.02% | +3.70% | +13.73% | +16.08% | +23.47% | +13.36% |
| Large Value | -1.16% | -3.17% | -0.32% | +15.49% | +18.87% | +19.36% | +12.30% |
| Mid Growth | +0.25% | +0.54% | -1.09% | +7.11% | +1.16% | +16.33% | +5.25% |
| Mid Blend | -0.15% | -2.13% | -0.83% | +10.89% | +9.69% | +17.50% | +7.51% |
| Mid Value | -0.44% | -4.01% | -0.58% | +13.41% | +15.99% | +18.02% | +9.39% |
| Small Growth | +0.84% | -0.52% | -3.97% | +14.20% | +14.40% | +18.14% | +4.50% |
| Small Blend | +0.03% | -2.62% | -3.58% | +13.10% | +14.07% | +17.34% | +6.94% |
| Small Value | -0.61% | -4.20% | -3.36% | +12.17% | +13.71% | +16.66% | +8.60% |
International Equity Market Summary — As of 10/2/26
European equities declined as rising oil prices and inflation concerns pressured government bond yields. The STOXX Europe 600 fell 1.1% in local-currency terms while Germany's DAX declined 0.7%, France's CAC 40 dropped and the UK's FTSE 100 lost more than 2%. France was a particular source of concern as investors focused on the government's fiscal outlook and its ability to reduce a large budget deficit.
Eurozone inflation accelerated to 3.8% y/y in September from 3.2% in August, above expectations of 3.6%. Inflation also accelerated across several major economies, reaching 3.3% in Germany, 3.0% in France and 4.9% in Spain. The stronger inflation data reinforced expectations that the ECB may need to keep policy restrictive. Concerns in France over the government's ability to pass a budget and reduce its fiscal deficit pushed French borrowing costs sharply higher and widened the spread between French and German 10-year bonds.
Japanese equities were mixed as the Nikkei 225 gained 2.9%, supported by AI and semiconductor-related stocks, while the broader TOPIX declined 0.9%. The divergence again demonstrated the global strength of technology oriented companies even as broader Japanese equities faced pressure from higher domestic yields and expectations for additional BoJ tightening. Tokyo-area core inflation accelerated to 2.7% y/y in September from 1.8% in August, while inflation excluding fresh food and energy reached 3.0%. That strengthened the case for further BoJ tightening. The 10-year Japanese government bond yield remained around 3.09%, while the yen traded near 157 per dollar. Policymakers continued to express concern about currency weakness.
Chinese equities weakened ahead of the Golden Week holiday. Through Wednesday, the Shanghai Composite fell 1.2% and the CSI 300 declined 1.8%, as technology and financial shares came under pressure from rising global yields and disappointment with Beijing's latest stimulus measures. Mainland Chinese markets then closed for the October 1–7 National Day holiday. Economic activity in China improved as the official manufacturing PMI increased to 50.1 in September from 49.8, returning to expansion. The official non-manufacturing index also returned to expansion at 50.2. Beijing announced additional support measures, including mortgage interest subsidies and expanded lending facilities, but investors remained skeptical that the package would be sufficient to resolve weak domestic demand and the economy's growing dependence on exports. Hong Kong's Hang Seng fell 2.19% for the week.
| Region | 1 Wk | 1 Mo | 3 Mo | YTD | 1 Yr | 3 Yr | 5 Yr |
|---|---|---|---|---|---|---|---|
| MSCI ACWI | -0.73% | -0.08% | +2.30% | +13.90% | +17.02% | +22.63% | +12.09% |
| MSCI ACWI ex USA | -1.40% | -1.90% | +0.22% | +13.73% | +18.34% | +20.85% | +9.59% |
| MSCI Emerging Markets | -1.23% | +0.76% | +2.07% | +23.68% | +27.47% | +24.25% | +9.11% |
| MSCI Europe Stock | -2.16% | -4.80% | -3.76% | +4.83% | +9.71% | +17.80% | +9.31% |
| MSCI Asia Pacific Stock | -0.81% | +1.06% | +2.95% | +23.37% | +26.48% | +23.28% | +9.64% |
| MSCI Latin America Stock | +1.03% | -2.65% | +4.85% | +16.15% | +28.36% | +16.64% | +12.90% |
Chart of the Week — 10/5/26
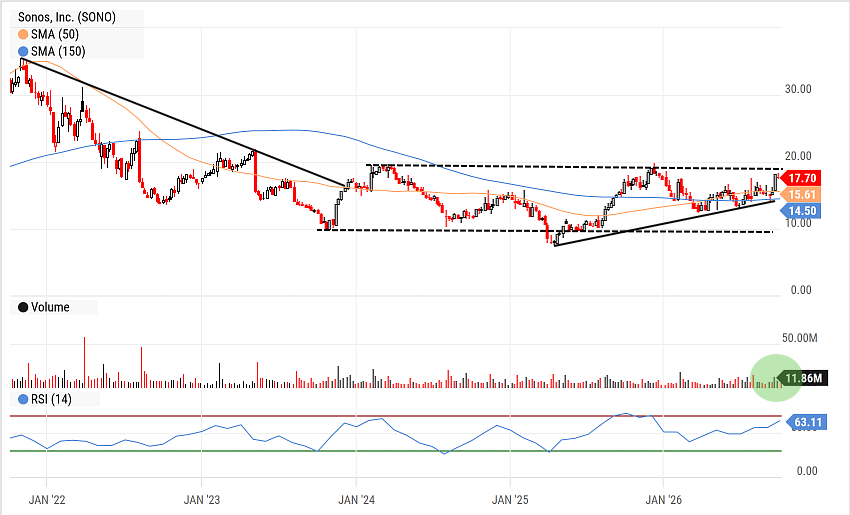
It has been a lost 5 years for SONO as it has declined from a late '21 high of $35 before bottoming below $10 in mid '25. It has been rangebound for the better part of 2 years and remains so. We may be jumping the gun but it appears to be setting up for another test of resistance at $19 which we want to be watching closely as clearing that will provide it with room to run. Maybe nibble now and add on a break above $19.
The Week Ahead
The economic calendar is considerably lighter this week following last week's wave of inflation, employment and GDP reports. Monday brings the September ISM Services Index, an important reading because services represent the majority of U.S. economic activity. With manufacturing continuing to expand and input prices rising, investors will pay particular attention to the prices paid component for a read through on how energy and other cost pressures are spreading through the economy.
The main event comes Wednesday with the release of minutes from the Federal Reserve's September meeting, when policymakers raised the federal funds rate 25 bps to 3.75%–4.00%. Markets will be parsing the report for evidence of how broadly policymakers supported additional tightening and what conditions would be required for another hike. Last week's employment report has dramatically shifted expectations of an October hike with odds falling to roughly 20% (CME Fedwatch Tool). The market is increasingly distinguishing between the outlook for short-term policy rates and long-term Treasury yields. Even if the Fed pauses in October, the 10-year Treasury could remain elevated because of inflation, fiscal deficits and heavy government borrowing. That means a Fed pause would not necessarily produce the decline in financing costs that equity investors would normally expect from a less hawkish policy outlook.
Friday brings the preliminary October University of Michigan Consumer Sentiment survey. Consumer confidence has weakened considerably as households confront higher energy costs and persistent inflation. Particular attention will be paid to inflation expectations, which could influence both Treasury yields and the Fed outlook. Despite the weak sentiment around consumers, the real economy continues to chug along, evidenced by last week's report, as do retail sales and consumer spending.
Corporate earnings also begin to move back into focus. Constellation Brands reports Tuesday, Levi Strauss Wednesday, PepsiCo Thursday and Delta Air Lines Friday. PepsiCo should provide another read on consumer pricing and demand, while Delta's results will offer insight into travel demand and the impact of elevated fuel costs. The broader Q3 reporting season begins in earnest next week. The S&P 500 has gained nearly 13% YTD despite the sharp rise in bond yields, in large part because investors continue to expect strong earnings growth and substantial AI-related capital spending. 3Q26 earnings season will be an important test of whether revenue growth and productivity gains are keeping pace with the extraordinary investment commitments being made across the technology sector.
Improvement in flows out of the Strait of Hormuz and the reopening of the Saudi pipeline to the Red Sea, along with reserve releases of diesel from the EU, have helped to bring crude prices off recent highs, but transportation and refining bottlenecks remain severe. Any improvement in crude oil prices would be helpful to take the edge off inflation expectations and bond yields.
Internationally, France remains a key risk to monitor as fiscal and political concerns push sovereign spreads wider. China's mainland markets remain closed through Wednesday for Golden Week and reopen Thursday, giving investors their first opportunity to react fully to the latest stimulus measures and holiday spending data.
| Company | Date | EPS Est. |
|---|---|---|
| Lamb Weston Holdings, Inc. | Tue Oct 6 | $0.77 |
| RPM International, Inc. | Tue Oct 6 | $1.32 |
| Constellation Brands, Inc. | Tue Oct 6 | $2.82 |
| Worthington Steel, Inc. | Tue Oct 6 | $1.16 |
| Applied Digital Corp. | Wed Oct 7 | ($0.35) |
| Levi Strauss & Co. | Wed Oct 7 | $0.48 |
| PepsiCo, Inc. | Thu Oct 8 | $2.43 |
| NovaGold Resources, Inc. | Thu Oct 8 | ($0.05) |
| Nurix Therapeutics, Inc. | Thu Oct 8 | ($0.37) |
| Delta Air Lines, Inc. | Fri Oct 9 | $1.74 |
| Data Release | Date | Est. |
|---|---|---|
| US ISM Services PMI | Mon Oct 5 | 55.0 |
| US Trade Balance on Goods | Tue Oct 6 | N/A |
| NY Fed Inflation Expectations | Wed Oct 7 | 3.7% |
| US Consumer Credit Outstanding MoM | Wed Oct 7 | $14.0B |
| US Initial Jobless Claims | Thu Oct 8 | 200.0K |
| 30-Year Bond Auction | Thu Oct 8 | N/A |
| US Consumer Sentiment (U. of Mich.) | Fri Oct 9 | 48.6 |
| US Oil Rig Count (Baker Hughes) | Fri Oct 9 | N/A |
Key Interest Rates — As of 10/2/26
| Rate | As of | Latest | 1 Mo Ago | 1 Mo % | 1 Yr Ago | 1 Yr % |
|---|---|---|---|---|---|---|
| 1 Month Treasury | 10/2/26 | 4.04% | 3.83% | +5.5% | 4.23% | -4.5% |
| 2 Year Treasury | 10/2/26 | 4.83% | 4.39% | +10.0% | 3.55% | +36.1% |
| 10 Year Treasury | 10/2/26 | 5.28% | 4.79% | +10.2% | 4.10% | +28.8% |
| 30 Year Mortgage | 10/1/26 | 7.28% | 6.66% | +9.3% | 6.30% | +15.6% |
| US Corporate AAA | 10/1/26 | 5.81% | 5.41% | +7.4% | 4.61% | +26.0% |
| US Corporate BBB | 10/1/26 | 6.19% | 5.71% | +8.4% | 4.97% | +24.5% |
| US Corporate CCC | 10/1/26 | 17.02% | 14.93% | +14.0% | 11.76% | +44.7% |
| Effective Federal Funds | 10/1/26 | 3.88% | 3.63% | +6.9% | 4.09% | -5.1% |
US Economy Indicators
| Indicator | As of | Latest | 1 Mo Ago | 1 Mo % | 1 Yr Ago | 1 Yr % |
|---|---|---|---|---|---|---|
| Consumer Sentiment | 9/30/26 | 48.10 | 55.20 | -12.9% | 55.10 | -12.7% |
| Unemployment Rate | 9/30/26 | 4.20% | 4.10% | +2.4% | 4.40% | -4.5% |
| Inflation Rate | 8/31/26 | 3.40% | 3.40% | 0.0% | 2.90% | +17.2% |
| Manufacturing PMI | 9/30/26 | 54.50 | 55.60 | -2.0% | 49.10 | +11.0% |
| Non Manufacturing PMI | 8/31/26 | 55.40 | 54.10 | +2.4% | 52.00 | +6.5% |
| Retail Sales | 8/31/26 | 668,877 | 660,638 | +1.2% | 630,770 | +6.0% |
| Building Permits | 8/31/26 | 1,394 | 1,433 | -2.7% | 1,347 | +3.5% |
Suggested Readings
- 1Institute For The Study of War: Iran Update, October 4, 2026
- 2Amazon News: The Race Our Nation Can't Afford to Lose
- 3Low-Hire, Low-Fire Labor Market Continues in September Jobs Report
- 4Can 'Super Intelligence' and a Non-Binding Safety Pact Solve AI's Image Problem?
- 5Can The U.S. Grow Its Way Out of Debt?
Leadership Insight
“For fiscal '27, we currently expect revenues to decline in the high single digit range. As Elliott outlined, we are making deliberate choices across portions of the portfolio, particularly in Nike Sportswear, the Jordan Brand and Greater China to improve the health of these businesses over time. We will continue to take actions to reduce supply across key parts of the marketplace in support of a healthier marketplace environment and stronger full price realization. We expect those actions will create pressure on reported revenues for the remainder of fiscal '27 and into '28.”
Stocks to Watch
For our full list of Stocks To Consider, contact Patrick Mullin at pmullin@timberpointcapital.com
U.S. equities were mixed as investors balanced a weak September employment report against ongoing inflation concerns and elevated oil prices which continued to push long-term Treasury yields higher. The S&P 500 slipped 0.3%, the Dow declined 1.3% and the Russell 2000 was essentially flat, while the Nasdaq Composite gained 0.5% and the S&P MidCap 400 rose 0.5%. Friday's rally following the employment report helped erase some of the week's earlier losses as investors took the news to mean that the Fed would be unlikely to hike rates further at its next meeting in October.
Sector performance was narrow as 8 of 11 SPX sectors were in the red with recent strength in the Technology sector (XLK), up 1.8% this week, to buoy the market cap weighted SPX. Energy (XLE) also gained, up 1.3%, on renewed fears of Iran war tensions and Utilities (XLU) gained 0.8% after having experienced steep losses over four of the past five weeks. Large-cap growth continued to outperform the broader market, reinforcing the importance of technology and AI-related companies to index-level returns.
Friday's September employment report showed a meaningful slowdown in hiring as nonfarm payrolls increased just 29K, well below expectations of approximately 90K, while the unemployment rate ticked up to 4.2% from 4.1%. July and August payroll growth was also revised down by a combined 60,000 jobs. JOLTS job openings fell to 7.08 million from a revised 7.34 million in July, while consumer perceptions of labor market conditions weakened to their lowest level in more than five years.
Inflation data also provided some relief as the PCE price index increased 0.3% m/m in August and 3.4% y/y, while core PCE rose 0.2% m/m and 3.0% y/y. Q2 real GDP growth was revised up sharply to a 2.2% annualized rate. The September ISM Manufacturing PMI registered 54.5, marking the ninth consecutive month of expansion, but the prices paid index jumped to 77.9 from 71.1, its highest level since May.
The 10-year Treasury yield reached approximately 5.34% during the week, its highest level in roughly 24 years, before easing after the employment report. Brent crude traded above $108/barrel as hopes for progress in the U.S.-Iran conflict faded. Gold struggled amid higher real yields, falling roughly 3.4% for the week to around $4,140/oz.
| Asset Class | 1 Wk | 1 Mo | 3 Mo | YTD | 1 Yr | 3 Yr | 5 Yr |
|---|---|---|---|---|---|---|---|
| S&P 500 | -0.25% | +0.84% | +3.48% | +13.81% | +16.35% | +23.27% | +13.74% |
| Dow Jones Industrials Average | -1.26% | -3.46% | -2.91% | +7.76% | +11.81% | +17.30% | +10.38% |
| NASDAQ | +0.45% | +3.78% | +5.41% | +17.52% | +19.74% | +27.75% | +14.13% |
| S&P MidCap 400 | +0.53% | -1.94% | -3.23% | +12.09% | +13.40% | +15.83% | +8.11% |
| Russell 2000 | -0.16% | -3.94% | -5.15% | +15.18% | +16.65% | +18.86% | +6.25% |
| Russell Micro Cap | -0.47% | -3.81% | -5.34% | +19.31% | +25.60% | +25.39% | +6.43% |
| Sector | 1Wk | YTD |
|---|---|---|
| -0.47% | -7.28% | |
| -2.46% | -1.15% | |
| -1.89% | +9.12% | |
| -1.80% | +3.55% |
| Sector | 1Wk | YTD |
|---|---|---|
| -2.34% | -5.44% | |
| +1.26% | +43.29% | |
| -0.28% | +10.43% | |
| +1.80% | +39.28% |
| Sector | 1Wk | YTD |
|---|---|---|
| -1.86% | +5.67% | |
| -2.65% | +8.68% | |
| +0.81% | -4.76% |
| Style | 1 Wk | 1 Mo | 3 Mo | YTD | 1 Yr | 3 Yr | 5 Yr |
|---|---|---|---|---|---|---|---|
| Large Growth | +0.33% | +4.18% | +6.60% | +12.47% | +13.72% | +26.50% | +13.92% |
| Large Blend | -0.27% | +1.02% | +3.70% | +13.73% | +16.08% | +23.47% | +13.36% |
| Large Value | -1.16% | -3.17% | -0.32% | +15.49% | +18.87% | +19.36% | +12.30% |
| Mid Growth | +0.25% | +0.54% | -1.09% | +7.11% | +1.16% | +16.33% | +5.25% |
| Mid Blend | -0.15% | -2.13% | -0.83% | +10.89% | +9.69% | +17.50% | +7.51% |
| Mid Value | -0.44% | -4.01% | -0.58% | +13.41% | +15.99% | +18.02% | +9.39% |
| Small Growth | +0.84% | -0.52% | -3.97% | +14.20% | +14.40% | +18.14% | +4.50% |
| Small Blend | +0.03% | -2.62% | -3.58% | +13.10% | +14.07% | +17.34% | +6.94% |
| Small Value | -0.61% | -4.20% | -3.36% | +12.17% | +13.71% | +16.66% | +8.60% |
The economic calendar is considerably lighter this week following last week's wave of inflation, employment and GDP reports. Monday brings the September ISM Services Index, an important reading because services represent the majority of U.S. economic activity. With manufacturing continuing to expand and input prices rising, investors will pay particular attention to the prices paid component for a read through on how energy and other cost pressures are spreading through the economy.
The main event comes Wednesday with the release of minutes from the Federal Reserve's September meeting, when policymakers raised the federal funds rate 25 bps to 3.75%–4.00%. Markets will be parsing the report for evidence of how broadly policymakers supported additional tightening. Last week's employment report has dramatically shifted expectations of an October hike with odds falling to roughly 20% (CME Fedwatch Tool). Even if the Fed pauses in October, the 10-year Treasury could remain elevated because of inflation, fiscal deficits and heavy government borrowing.
Friday brings the preliminary October University of Michigan Consumer Sentiment survey. Consumer confidence has weakened considerably as households confront higher energy costs and persistent inflation. Despite the weak sentiment around consumers, the real economy continues to chug along, as do retail sales and consumer spending.
Corporate earnings also begin to move back into focus. Constellation Brands reports Tuesday, Levi Strauss Wednesday, PepsiCo Thursday and Delta Air Lines Friday. PepsiCo should provide another read on consumer pricing and demand, while Delta's results will offer insight into travel demand and the impact of elevated fuel costs. 3Q26 earnings season will be an important test of whether revenue growth and productivity gains are keeping pace with the extraordinary investment commitments being made across the technology sector.
Internationally, France remains a key risk to monitor as fiscal and political concerns push sovereign spreads wider. China's mainland markets remain closed through Wednesday for Golden Week and reopen Thursday, giving investors their first opportunity to react fully to the latest stimulus measures and holiday spending data.
| Company | Date | EPS Est. |
|---|---|---|
| Lamb Weston Holdings, Inc. | Tue Oct 6 | $0.77 |
| RPM International, Inc. | Tue Oct 6 | $1.32 |
| Constellation Brands, Inc. | Tue Oct 6 | $2.82 |
| Worthington Steel, Inc. | Tue Oct 6 | $1.16 |
| Applied Digital Corp. | Wed Oct 7 | ($0.35) |
| Levi Strauss & Co. | Wed Oct 7 | $0.48 |
| PepsiCo, Inc. | Thu Oct 8 | $2.43 |
| NovaGold Resources, Inc. | Thu Oct 8 | ($0.05) |
| Nurix Therapeutics, Inc. | Thu Oct 8 | ($0.37) |
| Delta Air Lines, Inc. | Fri Oct 9 | $1.74 |
| Data Release | Date | Est. |
|---|---|---|
| US ISM Services PMI | Mon Oct 5 | 55.0 |
| US Trade Balance on Goods | Tue Oct 6 | N/A |
| NY Fed Inflation Expectations | Wed Oct 7 | 3.7% |
| US Consumer Credit Outstanding MoM | Wed Oct 7 | $14.0B |
| US Initial Jobless Claims | Thu Oct 8 | 200.0K |
| 30-Year Bond Auction | Thu Oct 8 | N/A |
| US Consumer Sentiment (U. of Mich.) | Fri Oct 9 | 48.6 |
| US Oil Rig Count (Baker Hughes) | Fri Oct 9 | N/A |
European equities declined as rising oil prices and inflation concerns pressured government bond yields. The STOXX Europe 600 fell 1.1% while Germany's DAX declined 0.7%, France's CAC 40 dropped and the UK's FTSE 100 lost more than 2%. Eurozone inflation accelerated to 3.8% y/y in September from 3.2% in August, above expectations of 3.6%. Concerns in France over the government's ability to pass a budget and reduce its fiscal deficit pushed French borrowing costs sharply higher.
Japanese equities were mixed as the Nikkei 225 gained 2.9%, supported by AI and semiconductor-related stocks, while the broader TOPIX declined 0.9%. Tokyo-area core inflation accelerated to 2.7% y/y in September from 1.8% in August, strengthening the case for further BoJ tightening. The 10-year JGB yield remained around 3.09%, while the yen traded near 157 per dollar.
Chinese equities weakened ahead of the Golden Week holiday. Through Wednesday, the Shanghai Composite fell 1.2% and the CSI 300 declined 1.8%. Mainland Chinese markets then closed for the October 1–7 National Day holiday. Beijing announced additional support measures but investors remained skeptical. Hong Kong's Hang Seng fell 2.19% for the week.
| Region | 1 Wk | 1 Mo | 3 Mo | YTD | 1 Yr | 3 Yr | 5 Yr |
|---|---|---|---|---|---|---|---|
| MSCI ACWI | -0.73% | -0.08% | +2.30% | +13.90% | +17.02% | +22.63% | +12.09% |
| MSCI ACWI ex USA | -1.40% | -1.90% | +0.22% | +13.73% | +18.34% | +20.85% | +9.59% |
| MSCI Emerging Markets | -1.23% | +0.76% | +2.07% | +23.68% | +27.47% | +24.25% | +9.11% |
| MSCI Europe Stock | -2.16% | -4.80% | -3.76% | +4.83% | +9.71% | +17.80% | +9.31% |
| MSCI Asia Pacific Stock | -0.81% | +1.06% | +2.95% | +23.37% | +26.48% | +23.28% | +9.64% |
| MSCI Latin America Stock | +1.03% | -2.65% | +4.85% | +16.15% | +28.36% | +16.64% | +12.90% |
| Rate | Latest | 1 Mo Ago | 1 Mo % | 1 Yr Ago | 1 Yr % |
|---|---|---|---|---|---|
| 1 Month Treasury | 4.04% | 3.83% | +5.5% | 4.23% | -4.5% |
| 2 Year Treasury | 4.83% | 4.39% | +10.0% | 3.55% | +36.1% |
| 10 Year Treasury | 5.28% | 4.79% | +10.2% | 4.10% | +28.8% |
| 30 Year Mortgage | 7.28% | 6.66% | +9.3% | 6.30% | +15.6% |
| US Corporate AAA | 5.81% | 5.41% | +7.4% | 4.61% | +26.0% |
| US Corporate BBB | 6.19% | 5.71% | +8.4% | 4.97% | +24.5% |
| US Corporate CCC | 17.02% | 14.93% | +14.0% | 11.76% | +44.7% |
| Effective Federal Funds | 3.88% | 3.63% | +6.9% | 4.09% | -5.1% |
| Indicator | Latest | 1 Mo Ago | 1 Mo % | 1 Yr Ago | 1 Yr % |
|---|---|---|---|---|---|
| Consumer Sentiment | 48.10 | 55.20 | -12.9% | 55.10 | -12.7% |
| Unemployment Rate | 4.20% | 4.10% | +2.4% | 4.40% | -4.5% |
| Inflation Rate | 3.40% | 3.40% | 0.0% | 2.90% | +17.2% |
| Manufacturing PMI | 54.50 | 55.60 | -2.0% | 49.10 | +11.0% |
| Non Manufacturing PMI | 55.40 | 54.10 | +2.4% | 52.00 | +6.5% |
| Retail Sales | 668,877 | 660,638 | +1.2% | 630,770 | +6.0% |
| Building Permits | 1,394 | 1,433 | -2.7% | 1,347 | +3.5% |
It has been a lost 5 years for SONO as it has declined from a late '21 high of $35 before bottoming below $10 in mid '25. It has been rangebound for the better part of 2 years and remains so. We may be jumping the gun but it appears to be setting up for another test of resistance at $19 which we want to be watching closely as clearing that will provide it with room to run. Maybe nibble now and add on a break above $19.
“For fiscal '27, we currently expect revenues to decline in the high single digit range. As Elliott outlined, we are making deliberate choices across portions of the portfolio, particularly in Nike Sportswear, the Jordan Brand and Greater China to improve the health of these businesses over time. We will continue to take actions to reduce supply across key parts of the marketplace in support of a healthier marketplace environment and stronger full price realization. We expect those actions will create pressure on reported revenues for the remainder of fiscal '27 and into '28.”
For our full list of Stocks To Consider, contact Patrick Mullin at pmullin@timberpointcapital.com
©2020 YCharts, Inc. All Rights Reserved. YCharts, Inc. ("YCharts") is not registered with the U.S. Securities and Exchange Commission as an investment adviser, broker-dealer or in any other capacity, and does not purport to provide investment advice or make investment recommendations. This report has been generated through application of the analytical tools and data provided through ycharts.com and is intended solely to assist you or your investment or other adviser(s) in conducting investment research.
All data, statistics and charts are courtesy of YCharts unless otherwise noted. Investment Advice is offered through Fortis Capital Advisors, LLC, 7301 Mission Road, Suite 326, Prairie Village, KS 66208.
While reasonable efforts were used to obtain information from sources believed to be reliable, Fortis Capital Advisors, LLC makes no representation that the information or opinions contained in this material are accurate, reliable, or complete. All information and opinions are subject to change without notice. You should not construe this report as an offer to buy or sell, as a solicitation of an offer to buy or sell, or as a recommendation to buy, sell, hold or trade, any security or other financial instrument.
Past performance is not indicative of future results. Investing involves risk, including the possible loss of principal. The information contained herein is provided for informational purposes only and should not be construed as investment, tax, or legal advice. Recipients should consult their own advisers before making any investment decisions.
Source: Timber Point Capital Management. Powered by Fortis Capital Advisors. Investment Advice is offered through Fortis Capital Advisors, LLC, 7301 Mission Road, Suite 326, Prairie Village, KS 66208. All rights reserved.