
The current Fed Chair, Jerome Powell, gave a very succinct description of the Volker Rule and its impact on the US inflation rate in 2020 at Jackson Hole. In the same speech he went on to expand the Fed policy portfolio even though one can argue that the Financial Crisis he refers to was not the Fed’s making.
“Forty years ago, the biggest problem our economy faced was high and rising inflation. The Great Inflation demanded a clear focus on restoring the credibility of the FOMC’s commitment to price stability. Chair Paul Volcker brought that focus to bear, and the “Volcker disinflation,” with the continuing stewardship of Alan Greenspan, led to the stabilization of inflation and inflation expectations in the 1990s at around 2 percent. The monetary policies of the Volcker era laid the foundation for the long period of economic stability known as the Great Moderation. This new era brought new challenges to the conduct of monetary policy. Before the Great Moderation, expansion typically ended in overheating and rising inflation. Since then, prior to the current pandemic-induced downturn, a series of historically long expansions had been more likely to end with episodes of financial instability, prompting essential efforts to substantially increase the strength and resilience of the financial system.””
Fed Chair Jerome Powell, Jackson Hole 2020 Conference
Under the Volker Rule operating procedures any departure from the 2% inflation rate triggers a response, or an Open Market Operation, the purchase and sale of securities in the open market by a central bank to implementation monetary policy. If the inflation rate exceeds 2%, it is prima facie evidence of too much money in the system. Hence the Fed is compelled to reduce the quantity of money circulating in the economy. It sells bonds, i.e., reduces its balance sheet, into the open market and receives cash in return. In doing so the Fed reduces the quantity of money circulating in the economy. It will continue to do so until the inflation rate reaches the 2% target. In contrast if the inflation rate falls below the 2% rate, it is prima facie evidence of too little money in the system and the Fed is compelled to buy bonds in the open market, i.e., expand its balance sheet, and pay for them by printing money. Doing so increases the Fed balance sheet and the quantity of greenbacks circulating in the economy.
Under these conditions the balance sheet will exactly match the monetary base, i.e., the greenbacks circulating in the economy. Under the Volker rule the Fed balance sheet is nothing more than the cumulative sum of all the open market operations and so is the monetary base or the greenbacks circulating in the economy. Figure 1 shows that prior to the Financial Crisis the Fed Balance Sheet (black line) and the Monetary Base were virtually identical (blue line). Since the Financial Crisis, they have not been. Something changed during the Bernanke Fed. Did the Bernanke operating procedures mark the beginning of the unraveling of the Volker Rule?

The Volker rule is fairly mechanical. It simply requires that the Fed react to the disturbances and accommodate changes in money demand in order to maintain price stability. However, this is a boring job for any ambitious central banker who believes that he or she is smart enough to be better than the Volker Rule. The likely improvement is an obvious one, to forecast the changes in money and credit demand, and anticipate and accommodate them before they happen. This way the economy would not experience any deviation from the target inflation rate, nor will it have to go through any adjustment costs restoring the equilibrium as it would under the Volcker Rule. According to Mr. Powell,
“Under Ben Bernanke’s leadership, the Federal Reserve adopted many of the features associated with flexible inflation targeting. Although the precise features of inflation targeting differed from country to country, the core framework always articulated an inflation goal as a primary objective of monetary policy. Inflation targeting was also associated with increased communication and transparency designed to clarify the central bank’s policy intentions. This emphasis on transparency reflected what was then a new appreciation that policy is most effective when it is clearly understood by the public.”
The so-called increased communication and transparency are only needed if the Fed is not following the Volker rule as we described. Communication is needed when the Fed is trying to anticipate and accommodate shifts in money demand. Mr. Powell goes on to say,
“Because the economy is always evolving, the FOMC’s strategy for achieving its goals—our policy framework—must adapt to meet the new challenges that arise.”
Is this a way for the Fed to anticipate the shifts in money demand? Is the Fed now focusing on more than the inflation rate? While we have no doubt that smart central bankers seek to refine and improve the Volker Rule, will they succeed? Only if their forecasting acumen is such that they can correctly anticipate the shifts in demand and accommodate them faster than the Volker Rule.
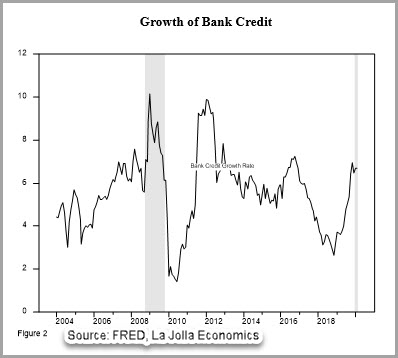
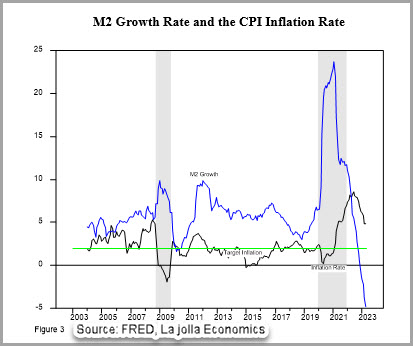
The Financial Crisis was the event where Mr. Bernanke made his bones and enhanced his reputation in such a way that it eventually led to a Nobel Prize. The Financial Crisis generated a flight to quality that capped the easy credit cycle that began in 2005. The flight to quality resulted in a collapse of the banking system’s credit creation, Figure 2, and resulted in an excess demand for money creating an incipient deflationary spiral, see Figure 3. The Fed accommodated the increase in demand for money by expanding its balance sheet, Figure 1, and thus prevented deflation, Figure 3. Mr. Bernanke acted promptly and provided enough liquidity to prevent the deflationary spiral. His success enhanced his reputation and that gave him the freedom to pursue other objectives. Once the crisis was averted, the Fed reduced the growth of the quantity of M2 and restored the inflation rate to the target rate. Figure 3 shows that the Fed did a reasonable job of staying near the target inflation rate during this time period.
Unfortunately, the Bernanke policies did not restore the economy to its pre-crisis monetary situation. Notice in Figure 1 that the Fed did not undo its balance sheet expansion (black line). We surmise that this was due to the concern that a rapid withdrawal of the monetary base could impact a fragile banking system’s credit creation and push the economy back into a recession. Hence the Fed adopted an asymmetric response to the crisis, and was quick to react and add liquidity and slowly to pull it out for fear of an economic slowdown. The asymmetric response fits quite well with the Phillips Curve, which posits a positive relationship between the inflation rate and the unemployment rate. Under the Phillips Curve the Fed’s optimal monetary policy strategy would be as follows: the Phillips Curve expects the inflationary pressure to rise as the unemployment rate declined, at which point the Fed would withdraw the excess money in order to prevent a surge in the inflation rate. The logic seemed impeccable if the Phillips Curve relationship between inflation and employment held empirically. Yet as Mr. Powell mentions,
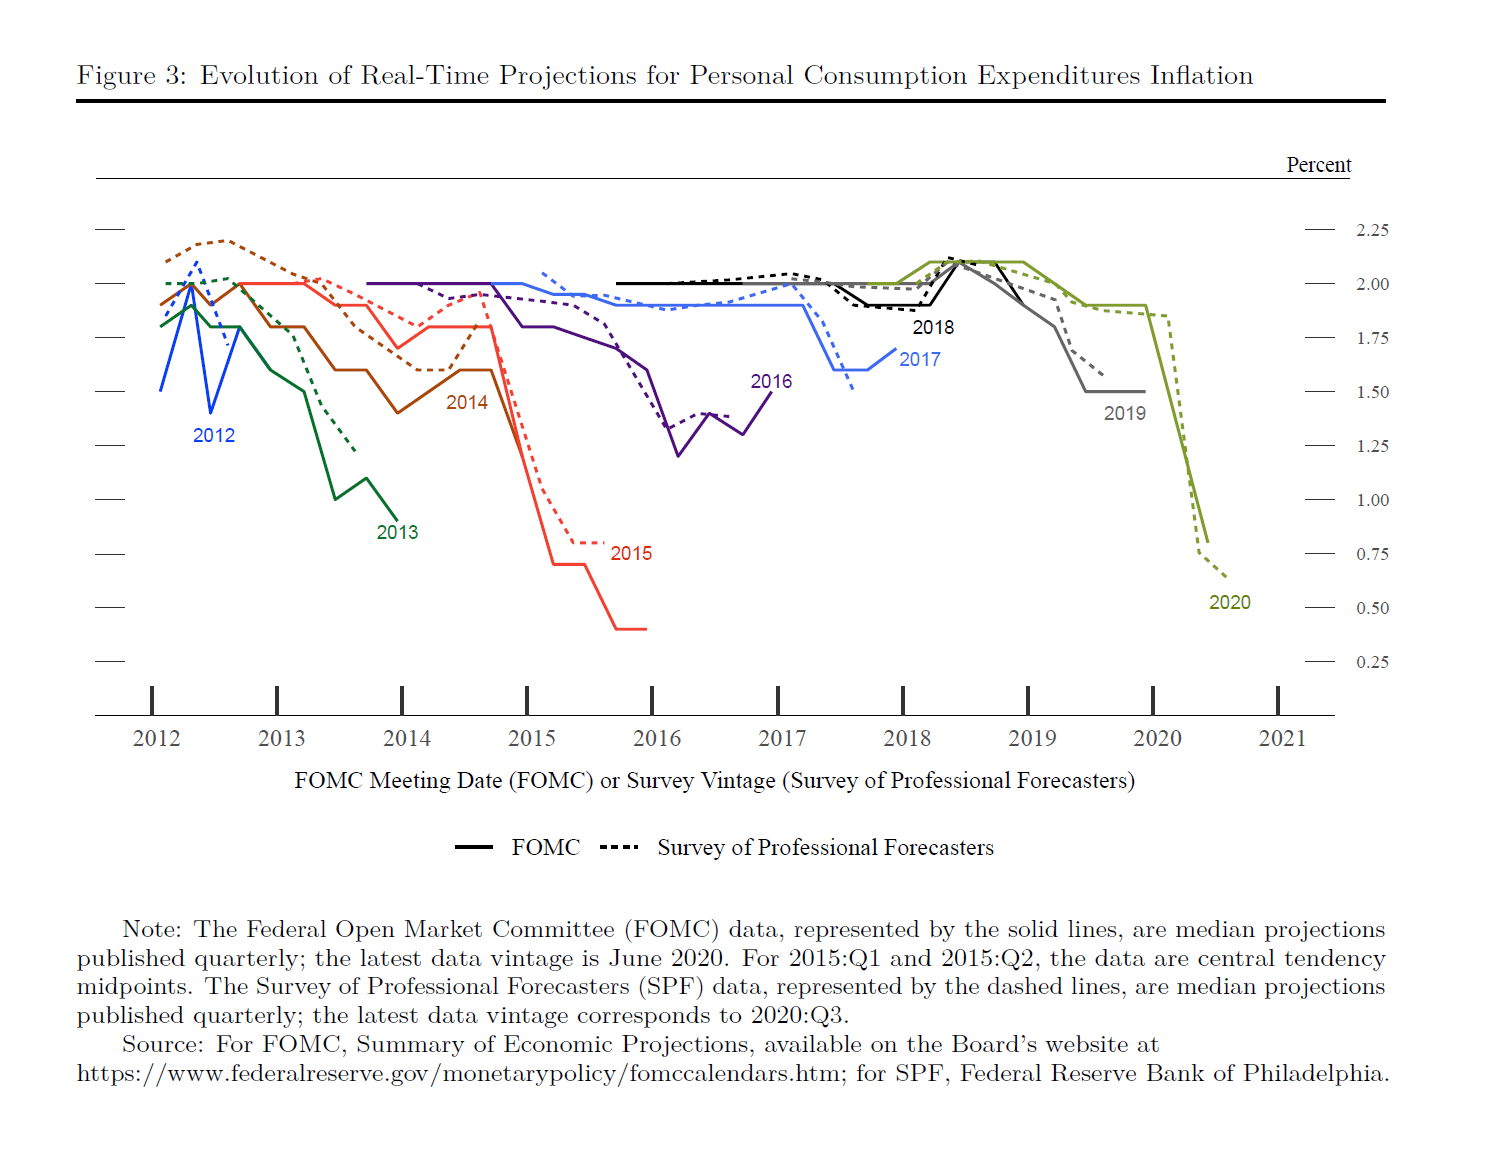
“The historically strong labor market did not trigger a significant rise in inflation. Over the years, forecasts from FOMC participants and private-sector analysts routinely showed a return to 2 percent inflation, but these forecasts were never realized on a sustained basis (see figure 3). Inflation forecasts are typically predicated on estimates of the natural rate of unemployment, or “u-star,” and of how much upward pressure on inflation arises when the unemployment rate falls relative to u-star.”
It seems that the Phillips Curve relationship did not hold as the Fed expected. Thus the Fed never had the chance to reduce the monetary base and or its balance sheet due to a surge in the inflation rate. The economy got stuck with an expanded balance sheet. Given the assumption of a Phillips Curve relationship, the below target inflation rate led the Fed to worry about a possibly deflationary bout if it attempted to reduce its balance sheet, i.e., monetary base. Hence the Fed had to find another way to deal with the excess monetary base printed during the Financial Crisis. And it did.
“On October 13, 2006, the Federal Reserve was granted authority by Congress to begin paying banks interest on the reserves they hold (IOR), with implementation scheduled for October 1, 2011. The Emergency Economic Stabilization Act of 2008 accelerated implementation, at the Fed’s request, to October 1, 2008. Under the authority granted by the Act, the Fed amended its Regulation D (Reserve Requirements of Depository Institutions) to mandate that regional Federal Reserve Banks pay interest to depository institutions on both their required and excess reserves.”
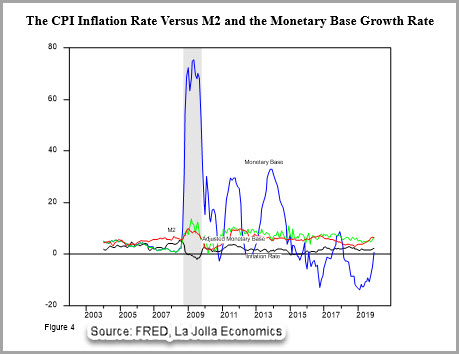
In simple terms the payment of the interest rate on excess reserves was a payment to the banks to keep these reserves idle. In doing so these reserves would not be used as currency in circulation nor would they be used as reserves backing deposits. Hence the excess reserves would not be part of M2. The excess reserves allowed the Fed to print greenbacks without increasing the quantity of M2 or the inflation rate. All of this suggests that focusing on the monetary base would overstate the number of greenbacks that the economy was truly using. To get a better sense of the possible impact of the monetary base we deducted the excess reserves from the monetary base to create an “adjusted monetary base” (green line). Looking at Figure 4 the usefulness of the adjustment becomes apparent. Growth in the adjusted monetary base provides a much better fit and explanation of the growth rate of M2 and inflation rate than the raw unadjusted monetary base (blue line) does. By not reversing the balance sheet expansion, the Fed had to deal with other problems. How to control and regulate the monetary aggregates without reducing its balance sheet? The indirect solution, the payment of interest on reserves, added one additional layer of complexity making it harder for the Fed to control the monetary aggregates as well as making it more difficult for the Fed followers to corroborate the Fed’s forward guidance. All of which leads us to conclude that paying interest on reserves as a solution to the alternative of reducing the balance sheet is second best and inferior to a direct solution.
In the Fed’s own words, here is a description of a key component pf the post crisis operating procedures:
“In its post-crisis monetary policy implementation framework, the Federal Reserve (Fed) sets a target range for the federal funds rate that is supported by two administered rates: the interest on reserves (IOR), which is earned by banks, and the offering rate at the overnight reverse repurchase (ON RRP) operations, which is earned by a broader set of financial institutions. IOR has been the primary monetary policy tool used to move the federal funds rate into the target range, while the ON RRP offering rate has been used to enhance rate control.”
The Fed statement is crystal clear, but this does not directly address the turning point that we have already referred to; the balance sheet reduction and excess reserves reduction during the 2015-2019 period. But the following Fed statement does.
“In the Policy Normalization Principles and Plans announced on September 17, 2014, the Federal Open Market Committee (FOMC) indicated that it intended to use an overnight reverse repurchase agreement (ON RRP) facility as needed as a supplementary policy tool to help control the federal funds rate and keep it in the target range set by the FOMC. The Committee stated that it would use an ON RRP facility only to the extent necessary and will phase it out when it is no longer needed to help control the funds rate.”
The mechanics of the reverse repos and its effect on the monetary base:
“When the Federal Reserve conducts an overnight RRP, it sells a security to an eligible counterparty and simultaneously agrees to buy the security back the next day. This transaction does not affect the size of the System Open Market Account (SOMA) portfolio, but there is a reduction in reserve balances on the liability side of the Federal Reserve’s balance sheet and a corresponding increase in reverse repo obligations while the trade is outstanding.”
In simple terms the ON RRPs are not part of the monetary base.
“The FOMC sets the ON RRP offering rate, which is the maximum interest rate the Federal Reserve is willing to pay in an ON RRP operation; the actual interest rate that a counterparty receives is determined through an auction process.”
The interest rates ON RRPs is the way the Fed attempts to divide its balance sheet into funds used for ON RRP and the residual which is nothing more than the monetary base. The two together add up to the balance sheet. The ON RRP is nothing more than the gap between the Balance Sheet and the Monetary Base reported in Figure 1.
“The Federal Reserve conducted technical exercises using ON RRPs beginning in September 2013 in order to gain operational experience and garner information about how such operations might be used during the policy normalization process.”
What about the impact of the increased monetary base on the credit system? Again, the excess reserves play a role. Banks are in the spread business or carry trade, they borrow short and lend long thus making the spread. Under the post Financial Crisis era banks now have a choice between making the spread and taking some risk or earning the interest on the idle excess reserves without incurring any risk. The banks must determine the differential between the loan spread and the interest payment on excess reserve that is high enough to compensate the banks for the incremental risk taken when making a loan vis a vis earning the interest on the idle reserves. If the Fed pays that rate, then at the margin the banks will not make the loans and thus they will have no need for the reserves, in which case they would take the risk-free interest payment. Hence through the payment of interest rates on excess reserves, the Fed could manage the composition of its balance sheet. Given the relative stability of the currency in circulation, the bulk of the adjustments in the monetary base will come out of the reserves backing deposits.
Next consider the effect of the changes in the composition of the balance sheet on the banking system. Loans will be made up to the point where, on a risk adjusted basis, the spread equals the interest on excess reserves. Once these loans are made, the required reserves needed to back up the deposits and loans can be calculated. If the reserves exceed the calculated amount, the excess can then be deployed as interest earning Reverse Repos. Now we consider what happens if the Fed increases the monetary base and the increment ends up as part of the reserves? In we continue the same assumptions as before, once banks have generated enough deposits to satisfy the loans they are making, the banks will not be willing to pay as high an interest rate on any incremental deposit. If anything, the interest paid will decline and the spread between the long- and short-term interest rates will increase.
In the limit, the interest rates will approach the opportunity cost of holding the currency in circulation, i.e., zero, and the spread or slope of the yield curve becomes nothing more than the interest rate charged on loans, i.e., the bond yield.
Reversing the process requires a joint reduction in the Fed balance sheet and the economy’s monetary base. In that case the shortage of reserves will induce the banks to encourage the private sector to hold less currency in circulation in order to increase the bank reserves and create additional loans. The way to do so is by increasing the opportunity cost of holding currency in circulation, that is by paying higher interest rates on deposits. The short-term interest rates rise and all else the same, the slope of the yield curve (green line) flattens. Our analysis produces several testable implications regarding the near zero interest rates and the slope of the yield curve approaching the long bond yields (blue line) during the post Financial Crisis. Figure 5 shows a time series for T-Bills, T-bonds and the slope of their yield curves, i.e., the difference between T-Bonds and T-bills.
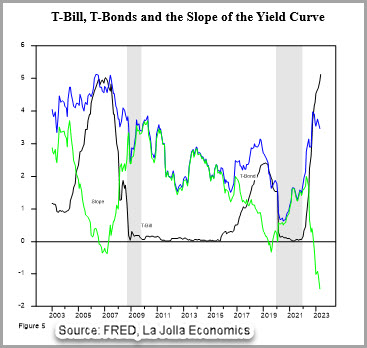
The data shows that during the Financial Crisis, the shaded area, T-bill yields increased, and the slope of the yield curve declined in dramatic fashion, a result consistent with an increase in the demand for currency in circulation, i.e., a flight to quality.
Then as the crisis abated and the Fed expanded its balance sheet, in order to dampen the monetary expansion and prevent an increase in the inflation rate, the Fed had to induce the banks to hold excess reserves. As mentioned earlier, we would expect this policy to result in a decline in the opportunity cost of holding cash. It did. As the short-term yields declined the slope approached the long bond yield, again, as we expected. Notice that the slope of the yield curve (green line) and the bond yields (black line) overlapped from the time of the financial crisis to the Fed’s announcement of its Policy Normalization Principles and Plans announced on September 17, 2014.
Once the Fed began to reduce its balance sheet, the short-term interest rates began to increase and the slope of the yield curve diverged from the long bond yields, just as our framework predicted. Also notice that during COVID, as the Fed dusted off the Bernanke Play book and expanded its balance sheet dramatically, see Figure 1, once again the short end of the yield curve approached zero and the slope of the yield curve approached the long bond yield.
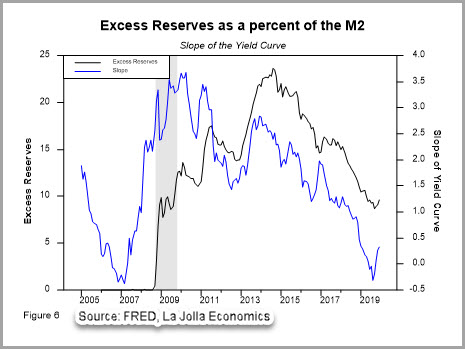
It was not until the Fed announced its balance sheet reduction that the short rates began to rise, and the slope of the yield curve began to diverge form the long bond yields. Figure 6 further reinforces our analysis. Notice the close correlation between the slope of the yield curve (blue line) and the excess reserves (black line) as a percent of M2. The excess reserves do a pretty good job at explaining the change in the slope of the yield curve. Furthermore to the extent that these changes precede the slope, one can then argue that they cause the changes in the slope. As shown here we have a simple and compelling explanation for the behavior of the interest rates.
Our interpretation of the data shows that the policies adopted by the Bernanke Fed prevented the surge in the inflation rate, Figure 3. But we also argue that the Fed’s attempt to manage the crisis via balance sheet expansion led to monetary and credit distortions that impacted the banking system’s credit creation and the economy’s asset valuation. While Bernanke got accolades and a Nobel Prize for his handling of the Financial Crisis, he did not do a roundtrip on the balance sheet expansion. He left the job of reducing the balance sheet to his successors. Furthermore, in order to maintain the low inflation rate, given that expanding the balance sheet even further was untenable, the Fed adopted additional policies such as paying interest rates on excess reserves that distorted the banking system credit market. It created a low short term interest rate environment and increased the benefits of the carry trade that tilted the balance into financial engineering.
The data suggests that something important happened to produce the 2015 turning point. But what was it? The balance sheet reduction was the important policy decision not the reverse repos. The latter only served to replace the excess reserve policy. In late 2014, taking a gradualist approach, the Fed began reducing its balance sheet and the excess reserves as a percent of M2 during 2015. The process continued up to the COVID crisis when it was interrupted as the Fed once again began to expand its balance sheet as a backstop to the financial system, see Figures 1 and 3.
The last nail in the coffin…The data in Figures 1 and 4 show that around 2015 the Fed set out to reduce its balance sheet and monetary base while simultaneously phasing out the excess reserves. It also announced that going forward it would rely on Reverse Repos to pursue its policy objectives and that the Reverse Repos would replace its policy of paying interest on excess reserves. Again, the Fed in its own words
“The Federal Reserve’s approach to the implementation of monetary policy has evolved considerably since the financial crisis, and particularly so since late 2008 when the FOMC established a near-zero target range for the federal funds rate. From the end of 2008 through October 2014, the Federal Reserve greatly expanded its holding of longer-term securities through open market purchases with the goal of putting downward pressure on longer-term interest rates and thus supporting economic activity and job creation by making financial conditions more accommodative. During the policy normalization process that commenced in December 2015, the Federal Reserve first used overnight reverse repurchase agreements (ON RRPs)–a type of OMO–as a supplementary policy tool, as necessary, to help control the federal funds rate and keep it in the target range set by the FOMC.”
By now the dismantling of the Volker Rule was almost complete. Here is Mr. Powell’s announcement:
“We have also made important changes with regard to the price-stability side of our mandate. Our longer-run goal continues to be an inflation rate of 2 percent. Our statement emphasizes that our actions to achieve both sides of our dual mandate will be most effective if longer-term inflation expectations remain well anchored at 2 percent. However, if inflation runs below 2 percent following economic downturns but never moves above 2 percent even when the economy is strong, then, over time, inflation will average less than 2 percent. Households and businesses will come to expect this result, meaning that inflation expectations would tend to move below our inflation goal and pull realized inflation down. To prevent this outcome and the adverse dynamics that could ensue, our new statement indicates that we will seek to achieve inflation that averages 2 percent over time. Therefore, following periods when inflation has been running below 2 percent, appropriate monetary policy will likely aim to achieve inflation moderately above 2 percent for some time.”
“In seeking to achieve inflation that averages 2 percent over time, we are not tying ourselves to a particular mathematical formula that defines the average. Thus, our approach could be viewed as a flexible form of average inflation targeting.26 Our decisions about appropriate monetary policy will continue to reflect a broad array of considerations and will not be dictated by any formula. Of course, if excessive inflationary pressures were to build or inflation expectations were to ratchet above levels consistent with our goal, we would not hesitate to act.”
“The revisions to our statement add up to a robust updating of our monetary policy framework. To an extent, these revisions reflect the way we have been conducting policy in recent years. At the same time, however, there are some important new features. Overall, our new Statement on Longer-Run Goals and Monetary Policy Strategy conveys our continued strong commitment to achieving our goals, given the difficult challenges presented by the proximity of interest rates to the effective lower bound. In conducting monetary policy, we will remain highly focused on fostering as strong a labor market as possible for the benefit of all Americans. And we will steadfastly seek to achieve a 2 percent inflation rate over time.”
And the chickens came home to roost…
The pandemic provided an opportunity for the Fed to test its new and “improved” operating procedures. The Federal government’s reaction to the pandemic caused the COVID related dislocations to unfold much faster than the dislocations caused by the Financial Crisis. A Reuters article written by Ann Saphir and Lindsay Dunsmuir “Timeline: Fed’s response – pandemic downturn vs financial crisis” documented the timeline and response differences. Here is the part that is of interest to us:
Friday, Feb. 28 – Powell releases a short statement pledging to “act as appropriate” in the face of economic impacts from the coronavirus outbreak as stock market losses accelerate, risk premiums on corporate bonds widen and the U.S. Treasuries market is hit by deep illiquidity.
Monday, March 2 – The Fed holds an emergency meeting by videoconference and unanimously decides to cut interest rates by 50 basis points as “a clear signal to the public that policymakers recognized the potential economic significance of the situation and were willing to move decisively.” The cut is announced on the morning of Tuesday, March 3.
Sunday, March 15 – After another emergency videoconference, the Fed slashes rates by 100 basis points to near zero, reintroduces forward guidance, restarts large-scale asset purchases and launches coordinated swap lines with five major foreign central banks, among other measures. One policymaker dissents. The Fed says the pandemic will take a “toll on U.S. economic activity in the near term” and makes clear it is “prepared to use its full range of tools to support the flow of credit to households and businesses.”
March 16-31 – The Fed launches range of measures to increase liquidity in financial markets and promises unlimited, open-ended large-scale asset purchases, including purchases of corporate and municipal bonds.
April 9 – The Fed rolls out a $2.3 trillion emergency lending effort to bolster local governments and small and mid-sized businesses.
As the crisis unfolded, the Fed reacted by dusting off and supersizing some of the policies implemented by the Bernanke Fed during the Financial Crisis. The Fed provided the needed backstop and as result it dramatically expanded, “supersized” its balance sheet. Its balance sheet increased by more than 50% during the early stages of the crisis and nearly doubled within the first 12 months, see Figure 1. Once the crisis was over, rather than reverse the balance sheet expansion the Fed followed the Bernanke blueprint. Instead of reducing the balance sheet, the Fed attempted to prevent the balance sheet expansion from filtering into the quantity of money circulating the economy. Yet some differences were apparent. The Bernanke Fed adopted the payment of interest rates on “excess reserves” while the Powell Fed did away with that Bernanke policy. It abolished the excess reserves and instead focused on Reverse Repos, the mechanism to manage the composition of the balance sheet in its attempt to control the monetary aggregates. Here is the timeline for the Reverse Repo policy implemented by the Fed:
September 2019 – the Federal Reserve used term and overnight repurchase agreements (repo) to ensure that the supply of reserves remain ample even during periods of sharp increases in non-reserve liabilities, and to mitigate the risk of money market pressures that could adversely affect policy implementation. The Federal Reserve continued to offer overnight repos and, amid the COVID-related stress around March 2020, term and overnight repos played an important role in ensuring that the supply of reserves remained ample and supporting the smooth functioning of short-term U.S. dollar funding markets.
March 15, 2020 – the Board reduced reserve requirement ratios to zero percent effective March 26, 2020. This action eliminated reserve requirements for all depository institutions.
July 28, 2021 – the Federal Reserve announced the establishment of a domestic standing repo facility (SRF). Under the SRF, the Federal Reserve conducts daily overnight repo operations against eligible securities. The SRF serves as a backstop in money markets to support the effective implementation of monetary policy and smooth market functioning.
It seems that the “smooth market functioning” does not include the US inflation rate, which the Fed claimed initially as transitory and since then has had a difficult time stamping out for fear of messing up some of the other policy objectives that it now attributes to itself. Judging from what happened to the inflation rate, we must conclude that either the Fed did not learn its lesson or perhaps during COVID it had other overriding concerns that took priority over the inflation rate. Either way the Fed failed in its implementation of monetary policy or expanded its portfolio to pursue other objectives. No matter how we slice it, the Fed appears to have lost its Volker Rule compass.

IMPORTANT DISCLOSURES
The information in this report was prepared by Timber Point Capital Management, LLC. Opinions represent TPCM’s and IPI’s opinion as of the date of this report and are for general information purposes only and are not intended to predict or guarantee the future performance of any individual security, market sector or the markets generally. IPI does not undertake to advise you of any change in its opinions or the information contained in this report. The information contained herein constitutes general information and is not directed to, designed for, or individually tailored to, any particular investor or potential investor.
This report is not intended to be a client-specific suitability analysis or recommendation, an offer to participate in any investment, or a recommendation to buy, hold or sell securities. Do not use this report as the sole basis for investment decisions. Do not select an asset class or investment product based on performance alone. Consider all relevant information, including your existing portfolio, investment objectives, risk tolerance, liquidity needs and investment time horizon.
This communication is provided for informational purposes only and is not an offer, recommendation, or solicitation to buy or sell any security or other investment. This communication does not constitute, nor should it be regarded as, investment research or a research report, a securities or investment recommendation, nor does it provide information reasonably sufficient upon which to base an investment decision. Additional analysis of your or your client’s specific parameters would be required to make an investment decision. This communication is not based on the investment objectives, strategies, goals, financial circumstances, needs or risk tolerance of any client or portfolio and is not presented as suitable to any other particular client or portfolio. Securities and investment advice offered through Investment Planners, Inc. (Member FINRA/SIPC) and IPI Wealth Management, Inc., 226 W. Eldorado Street, Decatur, IL 62522. 217-425-6340.
Recent Comments