The misery index is an economic indicator created by Arthur Okun and was memorialized in the Full Employment and Balanced Growth Act of 1978, also known as the Humphrey–Hawkins Act (HHA). The HHA directed the Fed to effectively promote the goals of maximum employment and stable prices and compelled testimony by the Fed chairman before Congress each February and July. In Congressional testimony, the Fed chairman is to set target ranges for various economic variables that depict growth, unemployment and inflation. The HHA expired in the late 1990’s, however the semi-annual testimony continues.
The misery index helps determine how the average citizen/voter is doing economically and consists of the sum of the unemployment rate and the inflation rate. The importance of these two key components of the index to voters is easily understood. The unemployment rate is an indicator of the potential disruption to employment and thus the retirement benefits, particularly union workers where salaries are largely based on seniority, of seniors. The inflation rate is a good indicator for the potential reduction in real retirement benefits that are not fully indexed for inflation. Thus, the misery index is a good macroeconomic indicator of potential disruption and/or decline in real benefits to workers. Importantly, the HHA does not address the methods used to achieve these two objectives and thus politicians have to decide how to allocate the different policy instruments of spending, tax rates and monetary policy between the two objectives, unemployment and inflation, in the HHA legislation.
The usefulness of the Misery Index
More than 40 years ago, one of the central themes of Ronald Reagan’s presidential campaign was to ask the American people whether they were better off at that time than they were four years earlier. Reagan knew that if he was able to get the voters to think about the misery index, he would have a good chance of convincing them that he could do better. The implication being that if you are not better off, perhaps you should not reelect the incumbent. Reagan was right, and he won the election.
We contend that voters are a bit more sophisticated and take into consideration the policies being enacted and their future impact on the index, rather than just the current reading of the index. Hence the misery index trend may matter. Voters also understand that when a new administration takes over and it wants to change the direction of the economy, it may take some time for the results to materialize, hence the first year may not be representative of the legislative impact. The mid-term may be a better proxy. Finally, the third year is the last full piece of information the voters will get before they go to the polls. Hence it also represents a useful piece of information.
Of course, all of this assumes that that the voters pay attention to the misery index. We contend that they will pay attention if it proves to be useful as both a good report card and a good forecasting tool. But is it? In order to answer these questions, we need to calculate the misery index for the different periods.
The Misery Index
We went back to the postwar period, and we calculated the averages for each year corresponding to the various administrations. We had to use some judgment regarding the classification of the administrations. We classified four administrations as a one-term administration. This led us to a double counting problem when considering the Kennedy-Johnson Administration. President Johnson succeeded President Kennedy, ran for president himself, and won re-election. However, he chose not to run for a “second” term. Hence, we count President Johnson’s full four-year term once as a one-term presidency and a second time as a second term of President Kennedy. In doing this, we are assuming that Kennedy would have been re-elected to a second term. In Table 1 and Table 2 we report the misery index for different time periods
The Misery Index performance
Table 1 reports the misery index for the last year of the prior administration, column 1, as well as the misery index during the first term, column 2, and if the administration was reelected it reports the misery index during the second term, column 3.
Table 1: Misery Index, term average
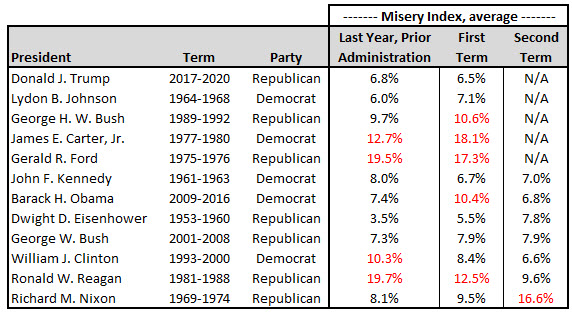
Source: La Jolla Economics
The data show that during the postwar era there have been 5 “one term” administrations – Trump, Johnson, George H.W. Bush, Carter, and Ford. It also shows that two of the administrations, Trump and Ford, that did not win reelection posted an average misery index lower than that of the last year of the prior administration. What gives? One possible answer is that there is more than economics when it comes to voters’ choice. We know that in the case of Gerald Ford, the Nixon impeachment may have tarnished his administration. The Trump defeat may also be explained in political terms. However, as Table 2 shows, the misery index deteriorated dramatically during Trump’s last year in office. One could argue that COVID was not Trump’s fault, however the president does bear responsibility for the handling of the economy and Covid response measures and perhaps the misery index reflects that.
Table 2, Misery Index, annual average
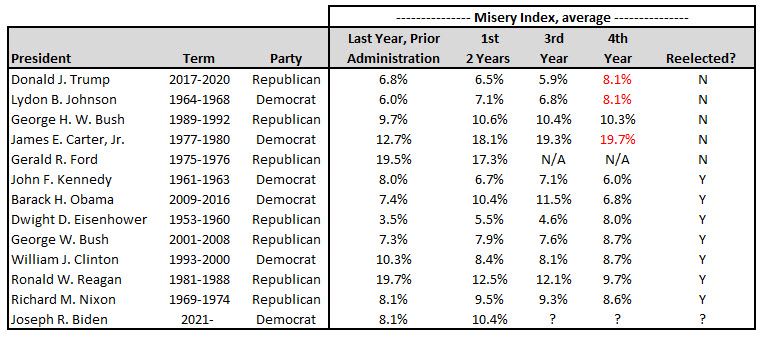
Source: La Jolla Economics
Seven administrations won the favor of the voters and were reelected to a second term – Kennedy, Obama, Eisenhower, George W Bush, Clinton, Reagan, and Nixon. Of these, the Obama administration appears to be an outlier as its misery index deteriorated and yet he still won reelection. However, this is easily explained. The voters understood that the surge in the misery index was due to the Financial Crisis inherited by the Obama administration. While opponents may argue that the policies adopted by the Obama administration may have delayed the recovery, they cannot lay the blame of the financial crisis on his administration. Table 2 shows that by his fourth year in office, as the crisis was averted and its effects faded, the misery index declined to 6.8%, well below the historical average. Thus, not surprisingly President Obama was reelected.
The George W. Bush administration posted little to no change in the misery index while the Eisenhower administration posted a slight deterioration, yet both won reelection. All of this suggests that modest changes in the misery index are not cause for voters’ concern. The one case that deserves attention is that of the Nixon administration. The misery index deteriorated and yet Nixon won reelection, and then things got even worse during the second term. Did the voters make a mistake? They obviously did and this outcome suggests that there is more than the misery index to consider when the voters make a decision that they may later regret.
While it is impossible to determine what the misery index would have been had some of the one term administrations won reelection, we do have information on the misery index during the second term of those who won reelection. From the data reported in Table 1, we calculate that one term administrations posted an average misery index of 11.9%, higher than the 9.9% average misery index posted by the prior administrations during their last year in office. This makes sense. Misery increased during their tenure, so they were not rewarded with a second term in office. In contrast those who were reelected posted an average misery index of 8.7% during their first term. Misery decreased, and they were rewarded accordingly. They outperformed the one-termers. But is past performance a good predictor of future performance? Well, during their second term the reelected administrations posted an 8.9% misery index. Not too different than what they posted during the first term. The evidence suggests that what you see is what you get and the misery index may be a good predictor of future economic performance.
What the Misery Index portends for the Biden administration?
Given that the Biden administration is only halfway through its first term, we do not have a full data set and will have to make an assessment based on how the misery index has performed thus far. We have already argued that perhaps the first two years of an administration may not be representative of its policies. The reason is that if adjustment is costly, it may take time for the economy to adjust to any new policies or policy direction being implemented by the incoming administration. During the first two years of the Biden administration, the misery index has averaged 10.4%, slightly higher than the average for the first two years of the previous administration, see Table 2. Hence viewed from this perspective, the Biden administration is in the middle of the pack as those who got reelected posted an average misery index of 9.5% versus an average of 11% for those who did not win reelection.
If, as we have argued, the first two years were a transition to a new environment, a strong case can be made that the transition is completed by the third year. Hence the third-year misery index will be a key variable in the voters’ mind when they go to the polls. The data reported in Table 2 show that the reelected administrations improved their misery index to 8.6% and further declined to 8.1% by the fourth year. In contrast the one termer’s misery index deteriorated to 11.6% by the fourth year. Looking at Table 2, the only administration to get reelected while posting a misery index over 9% was Reagan. As Table 2 also shows, the misery index for Reagan was declining at a very rapid clip at Year 4.
If the misery index is as good an indicator as we believe it is, then the Biden administration will have to engineer a decline in the index to the 8.6% range to have chance at reelection. Given the near-historical lows in the unemployment rate, we argue that it will be very difficult for the unemployment rate to decline and have a meaningful positive impact on the misery index. Simply put, there is too little upside and a great deal of downside as far as the unemployment rate is concerned. This leaves the inflation rate as the one variable that can accomplish the needed decline in the misery index for a Biden reelection. If unemployment is to remain unchanged, Biden will reach the desired range if the inflation rate declines by 2 percentage points – an achievable goal, in our opinion.
We believe the inflation rate is the domain of the Fed. Thus, despite whatever noise you may hear around the Biden reelection campaign, the simple misery index calculation and history suggests that the Fed’s success or failure in taming inflation will be the critical factor in determining Biden’s reelection.

IMPORTANT DISCLOSURES
The information in this report was prepared by Timber Point Capital Management, LLC. Opinions represent TPCM’s and IPI’s opinion as of the date of this report and are for general information purposes only and are not intended to predict or guarantee the future performance of any individual security, market sector or the markets generally. IPI does not undertake to advise you of any change in its opinions or the information contained in this report. The information contained herein constitutes general information and is not directed to, designed for, or individually tailored to, any particular investor or potential investor.
This report is not intended to be a client-specific suitability analysis or recommendation, an offer to participate in any investment, or a recommendation to buy, hold or sell securities. Do not use this report as the sole basis for investment decisions. Do not select an asset class or investment product based on performance alone. Consider all relevant information, including your existing portfolio, investment objectives, risk tolerance, liquidity needs and investment time horizon.
This communication is provided for informational purposes only and is not an offer, recommendation, or solicitation to buy or sell any security or other investment. This communication does not constitute, nor should it be regarded as, investment research or a research report, a securities or investment recommendation, nor does it provide information reasonably sufficient upon which to base an investment decision. Additional analysis of your or your client’s specific parameters would be required to make an investment decision. This communication is not based on the investment objectives, strategies, goals, financial circumstances, needs or risk tolerance of any client or portfolio and is not presented as suitable to any other particular client or portfolio. Securities and investment advice offered through Investment Planners, Inc. (Member FINRA/SIPC) and IPI Wealth Management, Inc., 226 W. Eldorado Street, Decatur, IL 62522. 217-425-6340.
Recent Comments