The Timber Log is a quick overview of Timber Point Capital’s most recent investment thoughts. If you have questions about the content, please reach out to Patrick Mullin. The information contained herein does not constitute investment advice or a recommendation for you to purchase or sell any specific security.
They’re back…Federal Reserve to weigh in on the stock market rally?
- 25bps expected from the Fed later today as the Fed stays “stronger and longer” to keep inflation expectations anchored
- The end of the Fed hikes are in sight but expect Fed to hit the 5% Fed funds rate by mid-year
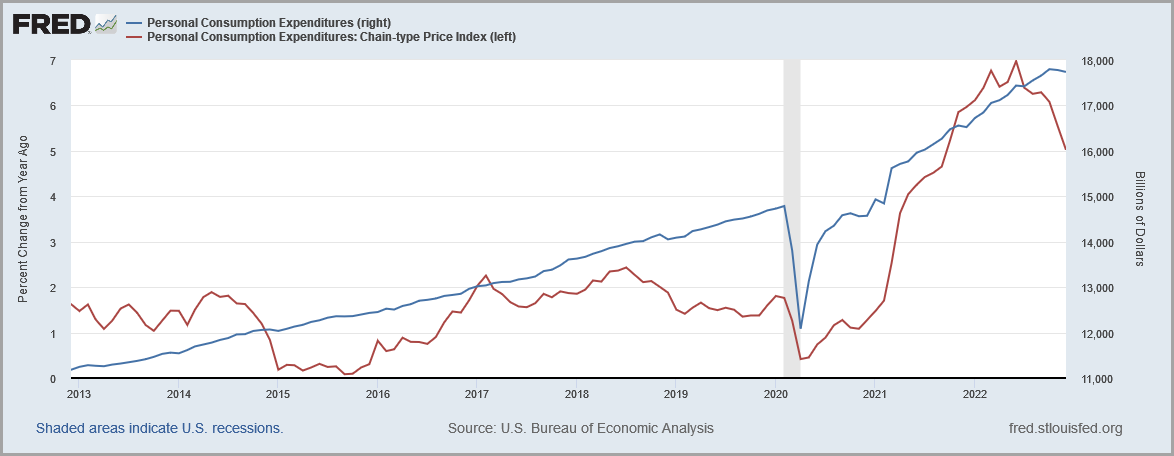
- Inflation has peaked, December PCE headline report was down 50bps m/m to 5%…after peaking at 7% in June ‘22
- Core PCE is stubborn due to lease inflation which we know is declining per 3rd party reports
- Powell is focused on “core services PCE, ex housing”…effectively wages and the job market
- 4Q22 Employment Cost Index showed slight moderation in wage gains…this will take time
- Layoff pain is spreading from big tech to industrial (MMM and F) and finance (GS)…chart
- Many of the layoffs are high paying jobs, a potential threat to consumer spending which is already looking stretched
- Labor market continues to look robust…the primary reason a soft landing remains in the cards
- The Fed is typically reticent in their minutes relative to the stock market…they prefer to jawbone the market with hawkish rhetoric – that is our bet…
- Next Fed meeting is March 21/22 giving investors time to digest corporate earnings which have replaced inflation as the primary financial market concern…
- Bottom line, the Fed will acknowledge inflation progress but won’t waver on their path to 5%…
- January’s “animal spirits” in the market will be passed off as normal volatility
January results are impressive and somewhat of an outlier versus history…
- January 2023 S&P 500 return of 6.18% is 8th best return since 1957 and 2nd best in the 21st century (2019, 8%)…2019 ultimately returned 31.5%…
- Average January returns back to 1957 are +95bps with standard deviation of ~500 bp’s…thus 1Q23 is a bit of an outlier given that only 9 quarters since 1957 have returned greater than 1 s.d.
- Like 2023, 2019 followed a down year (-4.4%) with Jan ’19 the culmination of a 3+ year rate hike cycle which saw eight rate hikes of 25 bps to 2.5%
- 2019 saw the Fed reverse policy with three 25 bp rate cuts in July, September and October…PCE inflation was an afterthought at 1.5%…
- The similarities to 2019 are interesting, will 2023 see rate cuts in 2H? Ultimately, the pace of 2022 Fed hikes and ultimate trajectory to 5% could prove difficult
- And don’t forget that the Fed’s balance sheet was 50% of current levels and national debt was 2/3 of today levels…the Fed is now serious about withdrawing liquidity
- By major asset class, stocks outperformed bonds by 2x…small cap (IWM) outperformed both mid and large (IWR and SPY) by 100 bps and 370 bps…
- S&P 500 Value beat S&P 500 Growth confirming trends that appeared in 2H22…net net, growth has rallied hard but so have value names…
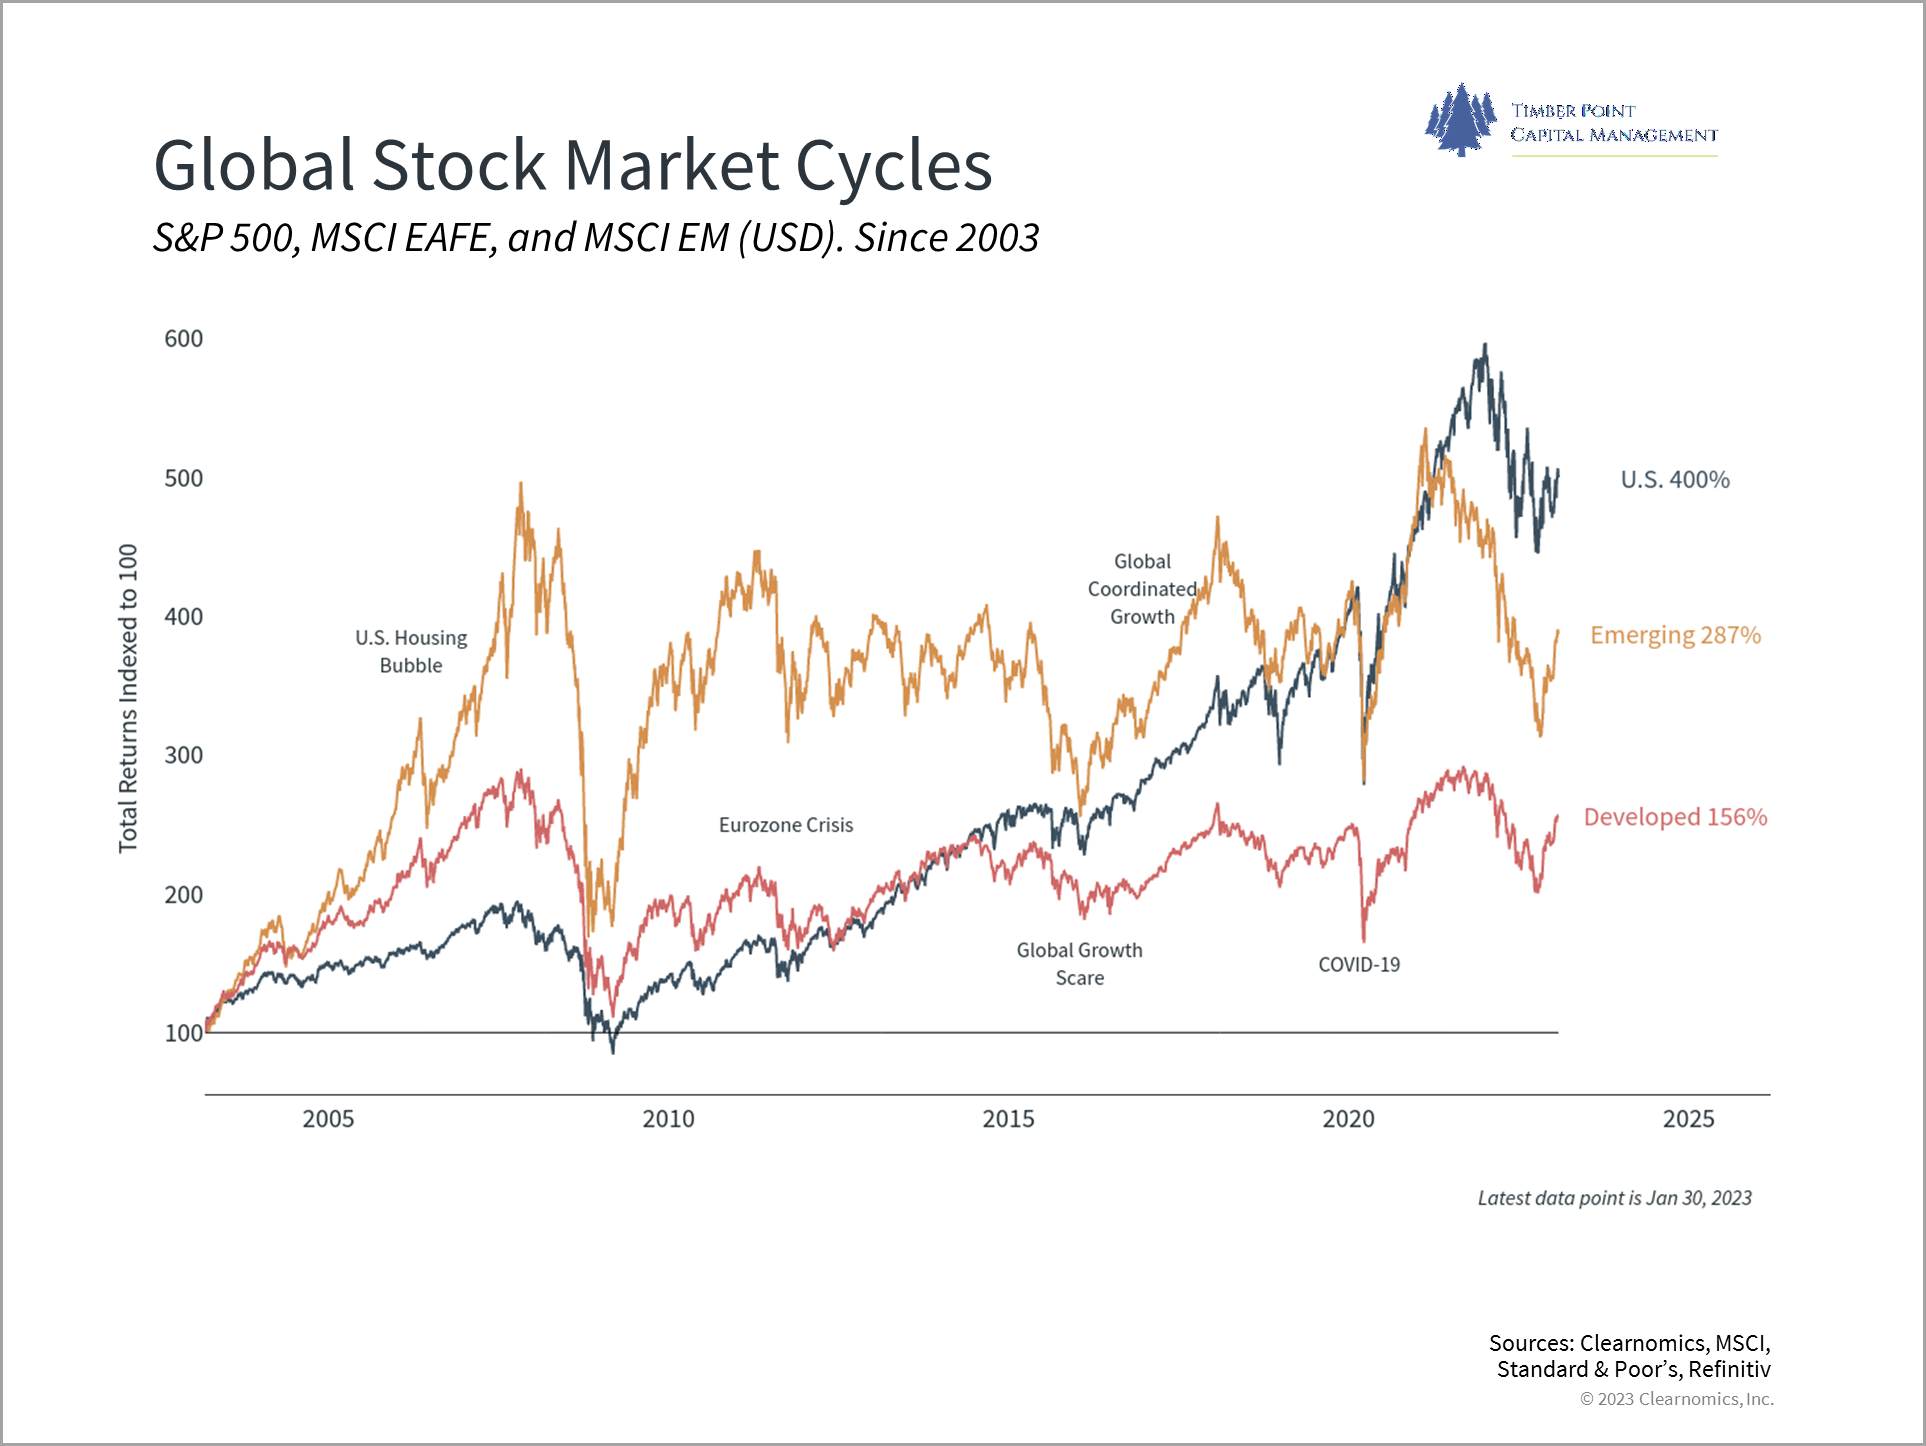
- Both international indices, EFA and EEM, outperformed the S&P 500 by ~ 300 bps
- China (FXI) surged 12.4% with the re-opening and German (EWG) rose 13.4% owing to a warmer than expected winter…
- We continue to favor down market cap, value and international equity exposure
Debt ceiling…the boy who cried wolf again? A quick history…
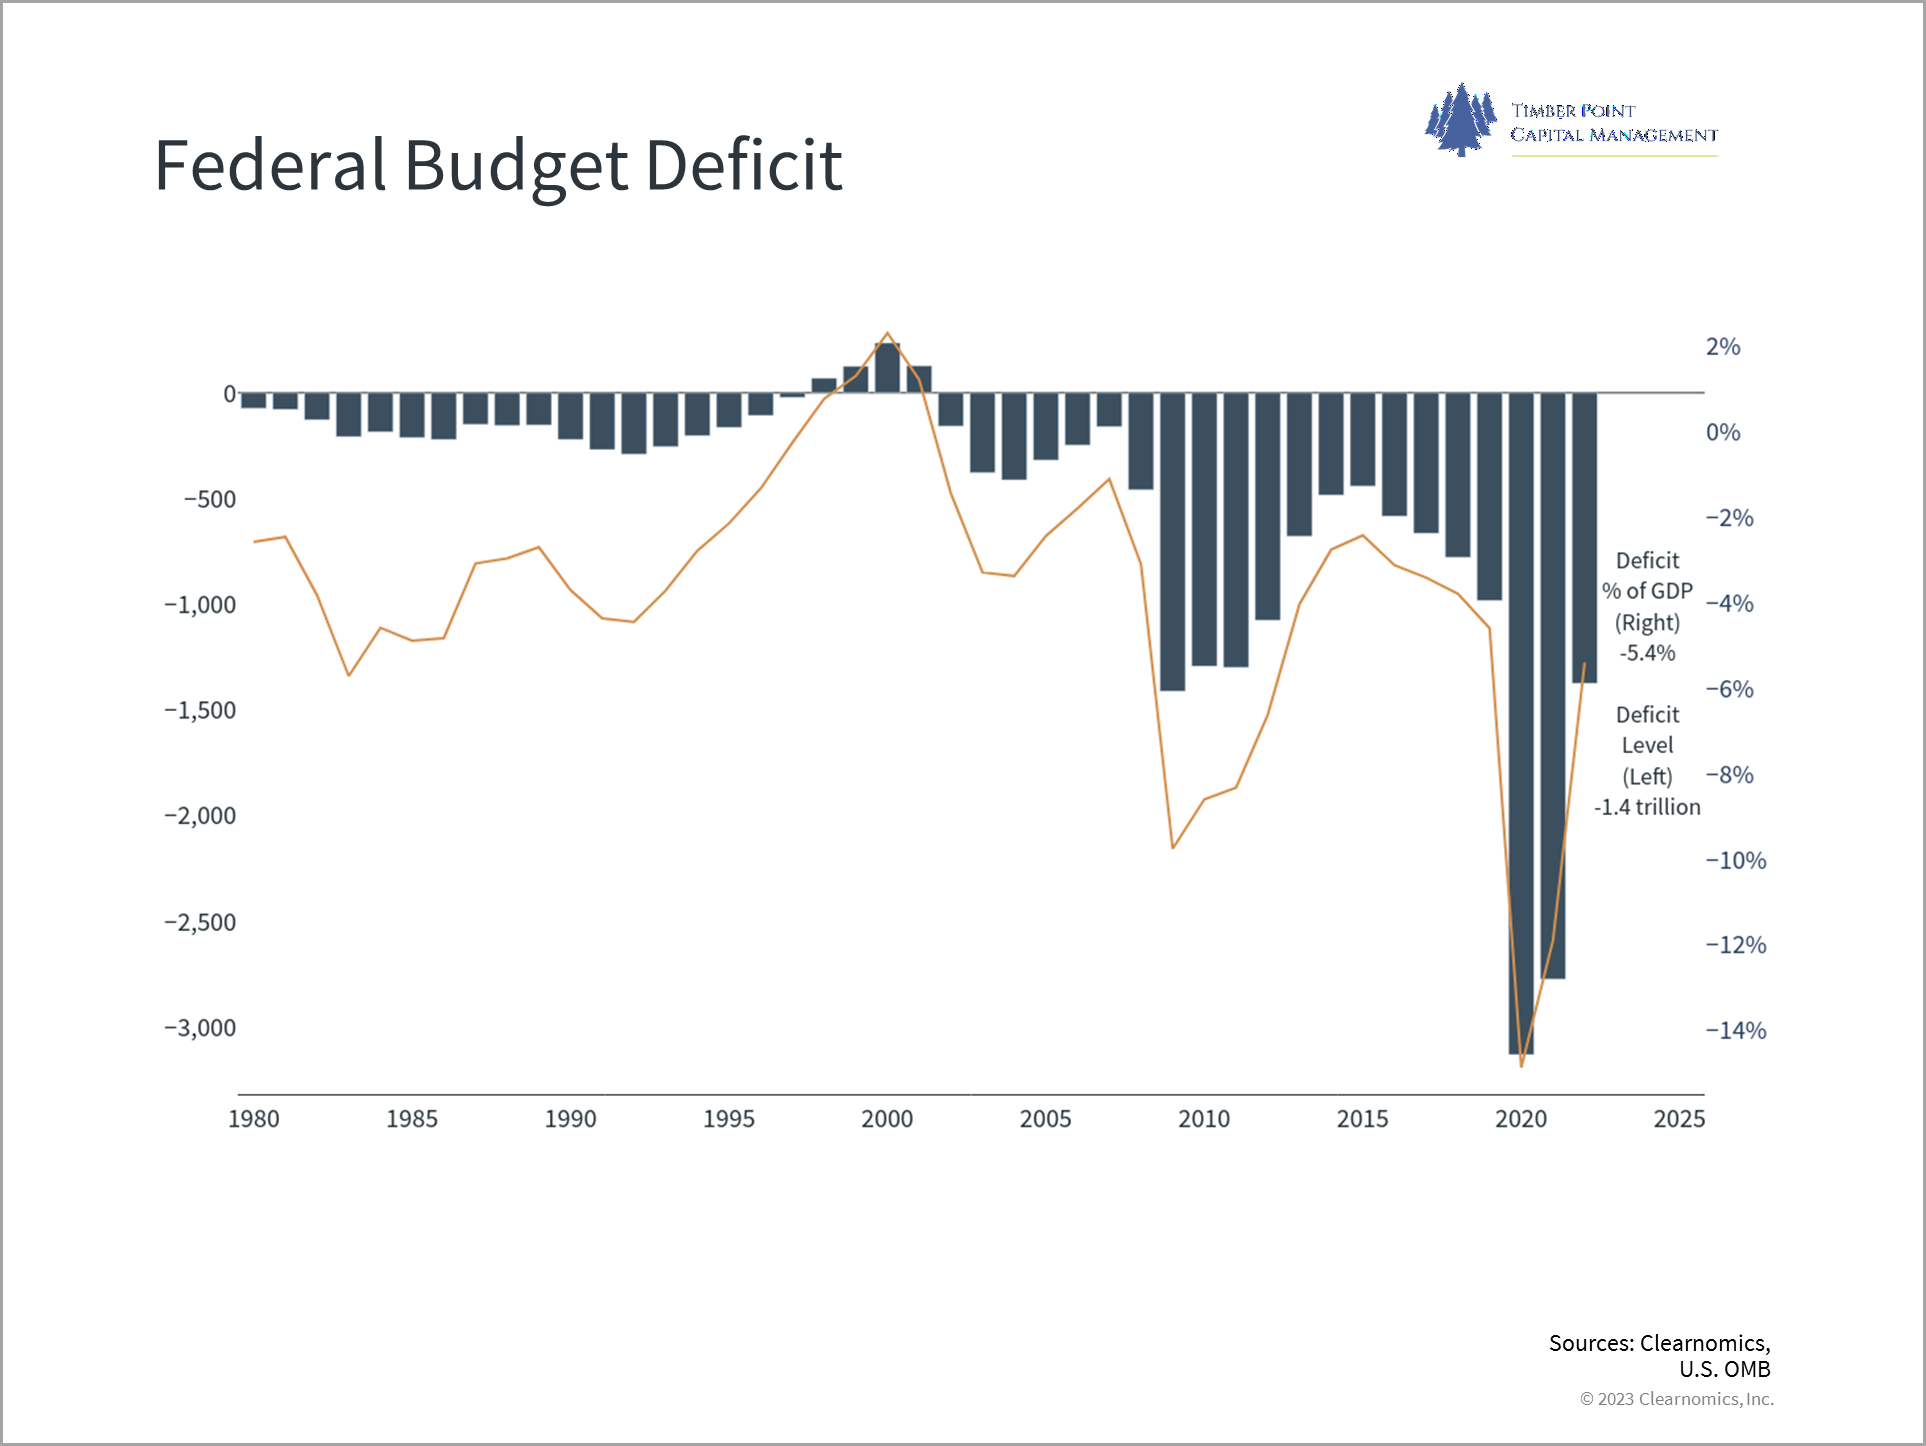
- We had to look up how many times the debt ceiling has been increased since enacted in 1917…the answer is 90 times…it has never been reduced, big surprise
- Both Republicans and Democrats are to blame for running annual deficits…the last budget surplus was 2001 under Clinton
- The market is looking past this, don’t they eventually always settle? Yes, but…
- There have been government shutdowns in the past, especially with a split Congress…
- 1995 – 1996 standoff between Clinton and Gingrich…there was no discernible impact on the stock market; the standoff helped lead to four consecutive years of budget surpluses
- 2011 – stalled negotiations led to an S&P 500 decline of 15% between August and September…the U.S. credit rating was indeed downgraded…
- 2013 – non-event as the market churned higher as Congress debated from January until May
- With the Treasury forgoing making payments, it is estimated the debt limit will be reached in 2Q23 if no deal is reached
- Democrats opening position is that there will be no negotiations or conditions tied to raising the debt limit
- Republicans want to shrink the size of the budget deficit…the usual positions have been taken
- Freedom Caucus members who challenged House Speaker McCarthy will likely be very vocal on any potential deal…
- As part of the deal for McCarthy’s ascension three hardliners were named to the Rules Committee (Norman, Ray and Massie)…they may well decide what legislation is brought forward
- Too early to call right now but this may not be the perfunctory exercise with limited market impact that the majority of investors are expecting…bears watching
”Baby, It’s WARM Outside”…Natural Gas prices slide too far, too fast?
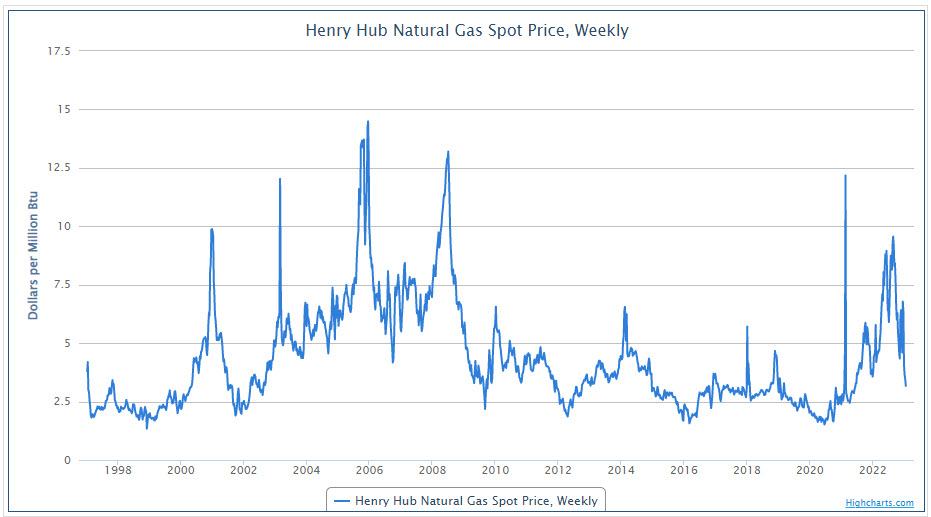
- The past year has been a wild ride in natural gas markets as European natural gas prices hit record highs and U.S. prices hit 14-year highs
- Obviously, Russia’s invasion of Ukraine and subsequent withdrawal of natural gas prompted a “re-think” of European energy supply
- This caused a spike in U.S. prices as domestic supplies were diverted into the LNG market to fill European storage
- Mild fall weather in Europe as well as user restraint, both residential and industrial, meant Europe was successful in building storage
- This has resulted in European storage levels now being ~ 50% above the 5-year average – crisis averted
- Likewise, the U.S. has experienced unseasonably warm winter weather, except for a cold snap in late December
- With U.S. production at record levels, U.S. inventories have reversed themselves from a deficit to a surplus when compared to 5-year averages
- Further complicating the U.S. outlook has been the shut-in of the Freeport LNG plant which provides 20% of the U.S. export capacity, effectively trapping these volumes in the U.S.
- Thus, both U.S. and European prices have retraced back to “pre-war” levels, declining by 70% and 80%, respectively
- As is oft said in the energy patch, “the cure for low prices is low prices”…the natural gas rig count is now plateauing as realized prices approach cost breakeven levels
- With the shoulder months approaching it is probably best to be cautious on a natural gas rally despite the drastic price action of the past few months
- Wild cards include escalation in Ukraine/Russian tension, faster than expected re-opening in China which diverts gas supplies and cold snaps to end winter or early/extended/great heat to add to cooling load in the summer
- UNG is a tough instrument to play with the futures market in contango as out month futures decay to spot prices…more of a shorter term trading vehicle
IMPORTANT DISCLOSURES The information in this report was prepared by Timber Point Capital Management, LLC. Opinions represent TPCM’s and IPI’s’ opinion as of the date of this report and are for general information purposes only and are not intended to predict or guarantee the future performance of any individual security, market sector or the markets generally. IPI does not undertake to advise you of any change in its opinions or the information contained in this report. The information contained herein constitutes general information and is not directed to, designed for, or individually tailored to, any particular investor or potential investor. This report is not intended to be a client-specific suitability analysis or recommendation, an offer to participate in any investment, or a recommendation to buy, hold or sell securities. Do not use this report as the sole basis for investment decisions. Do not select an asset class or investment product based on performance alone. Consider all relevant information, including your existing portfolio, investment objectives, risk tolerance, liquidity needs and investment time horizon. This communication is provided for informational purposes only and is not an offer, recommendation, or solicitation to buy or sell any security or other investment. This communication does not constitute, nor should it be regarded as, investment research or a research report, a securities or investment recommendation, nor does it provide information reasonably sufficient upon which to base an investment decision. Additional analysis of your or your client’s specific parameters would be required to make an investment decision. This communication is not based on the investment objectives, strategies, goals, financial circumstances, needs or risk tolerance of any client or portfolio and is not presented as suitable to any other particular client or portfolio. Securities and investment advice offered through Investment Planners, Inc. (Member FINRA/SIPC) and IPI Wealth Management, Inc., 226 W. Eldorado Street, Decatur, IL 62522. 217-425-6340.
Recent Comments