 The Timber Log is a quick overview of Timber Point Capital’s most recent investment thoughts. If you have questions about the content, please reach out to Patrick Mullin. The information contained herein does not constitute investment advice or a recommendation for you to purchase or sell any specific security.
February comes in like a dove and leaves like a hawk…
- Stronger economic data than consensus (employment, consumer) and less progress on inflation prints spook investors
- Near term hopes for a Fed pivot or pause in ’23 dashed…odds for a 50 bps hike in March rise from 3% to 25%…(CME)
- Further, odds for a 3rd rate hike in ’23 (June) increase from 15% to 56%…this is indeed stronger for longer…(CME)
- We do not believe 50 bps is on tap in March…the Fed will not want to spook markets and will want to see more economic data to assess lag effect of prior hikes
- We have been here before…disinflation hopes were dashed in 2022 multiple times but inflation is trending lower
- While not as linear or at a pace investors would hope, we believe inflation prints will moderate led by OER and rental price declines
- The S&P 500 declined by 2.6%, only somewhat offsetting the nice January gains of 6.2%…not so bad, people….
- Most interesting equity action in February may be small and mid-cap performance…declines of 1.35% and 1.95%, respectively…yet both are still up 7%-8% on the year
- The Bloomberg Aggregate Index declined by 2.8%…T-bill yields approach 5% and 10-year trades over 4%…
- High yield bonds, despite a rough patch mid-month, decline 100bps less than the AGG…still up 2% for the year
- On a 3, 6 and TTM basis, high yield is outperforming the AGG by 150 bps, 300 bps and 400 bps…
- Cyclical sectors of tech, industrials, consumer disc and financials outperform lower beta/risk off sectors…(SPDR)
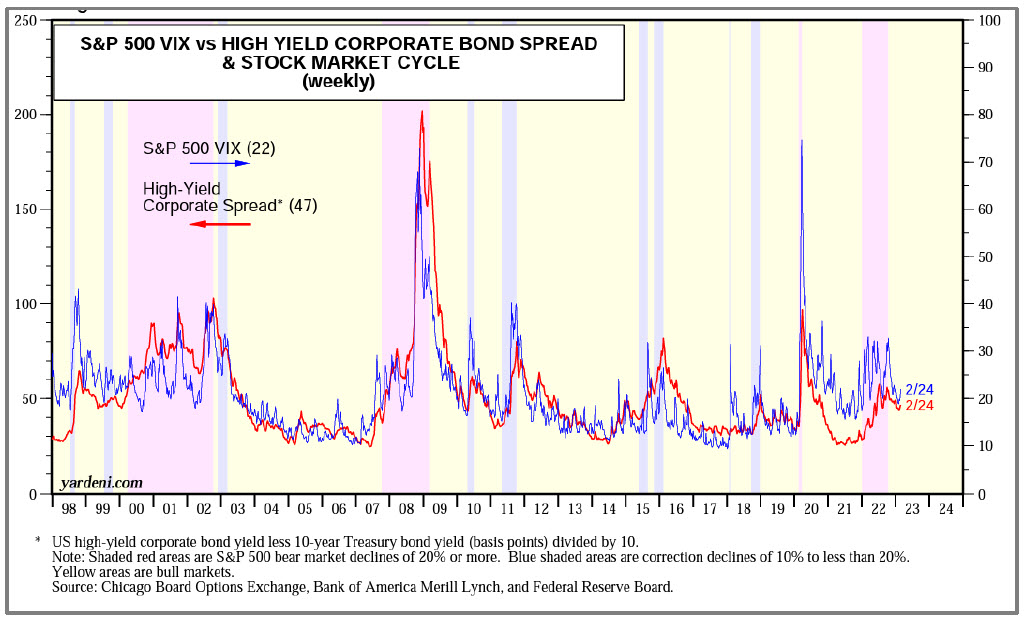
- As the chart above shows, volatility and credit spreads are off their lows but are not indicating any economic pressure
- Bottom line…we understand inverted yield curve and LEI reading can be powerful recession indicators…
- For now, asset class and sector performance suggests to us that a recession is not in the offing near term…
- Inflation prints should continue to show progress which should calm investor fears and provide a bid back to the equity market

LNG Outlook…Europe will continue to be pressured by loss of Russian gas
- We recently listened to Shell’s outlook for the global LNG market…our notes and takeaways are below…
- Global LNG supply grew by 16 million tons (MT) in 2022 to ~400 MT…this compares to growth of 21MT in 2021
- European LNG demand grew by multiples of industry supply in ‘22, up 60% or 45MT, in an effort to offset lost Russian pipeline gas
- European demand was satisfied by fewer imports to China (covid lockdowns), South America (increased hydro) and South Asia (price elastic)
- China LNG demand typically outgrows GDP…fortunately 2022 saw LNG volumes declined by 20% despite marginal GDP growth which allowed spot cargos to flow to Europe
- With high prices in Europe, LNG was no longer affordable in South Asia (Bangladesh, Pakistan, India) which have invested in infrastructure to support volumes….
- In total, imports decline by 11-16% in South Asia also driven by FX declines which raised prices further and led to coal/liquids switching and power outages
- U.S. operated at full capacity in 2022, ex the Freeport shutdown…and was the largest supplier of incremental LNG at 6MT, Norway was the next largest at 2.8MT
- Top LNG export countries are Australia, Qatar and U.S. each supplying ~ 80MT…followed by Russia and Malaysia each with ~ 30MT
- Europe is now the top importer at 120MT…followed by Japan at 70MT, China at 60MT and South Korea at 45MT…
- The global LNG market remains tight as liquefaction utilization is almost 90%…the highest in past 5 years…
- Russian pipeline gas is not expected to return…they had supplied ~30% of European gas demand…~ 60% of German gas demand
- Growth in the LNG supply is expected to be 15MT in 2023…most from higher output at existing projects like Freeport
- The loss of the Nord Stream gas pipeline in Europe means that European demand will be 2-3X what it has been in the past…
- Thus, as China recovers…and IF weather normalizes…2023 and forward could be difficult and costly for Europe to procure LNG
- Impact on global market…North Asia has no alternatives, it will pay for LNG…South Asia will find other supplies…Europe had been the balancer in the market, no longer
- China has invested in domestic supply, both traditional and renewable and could become the new balancing market…
- New supply additions between now and 2030 will be 80% supplied by Qatar and the U.S…largely under long term contract
- The difference in pricing mechanisms for the two providers (US = gas based, Qatar = oil based) will make for difficult procurement decisions by purchasers
- The U.S. gas market will increasingly by driven by LNG as its call on supply will grow from a nominal amount to over 20% by the end of the decade…thus, there will be a far greater relationship between U.S. and global gas markets…
Spring is here…will the housing market rebound continue?
- Housing related ETF’s, XHB and ITB, have had a substantial bounce off their October ’22 lows, up ~ 50% at the end of January…
- February declines of 10% were in reaction to higher interest rates in February…
- Affordability is certainly a factor as median house prices remain up 1.2% y/y while 30-year fixed rates hover near 7%…
- Reflecting this, the Mortgage Banker Association (MBA) purchase index has now declined to a 28 year low (1995)
- Builders are limiting supply as new residential construction has declined over the past 5 months to 1,339 starts from a Dec ’21 peak of 1,896
- While inventory of existing U.S. homes is low, now at 870K homes compares to normal 40-year average of 2.15MM (NAR)…inventory of existing home has increased to 2.9 months from 1.6 months in January ’22 but still reflect only 3 months of supply
- Thus supply and demand seem to be fairly well balanced, a large reason why pricing has not plummeted…
- Further stabilizing the market is homeowners that are reluctant to sell a low interest rate mortgage home and/or are waiting for a further rebound in prices as inflation subsides
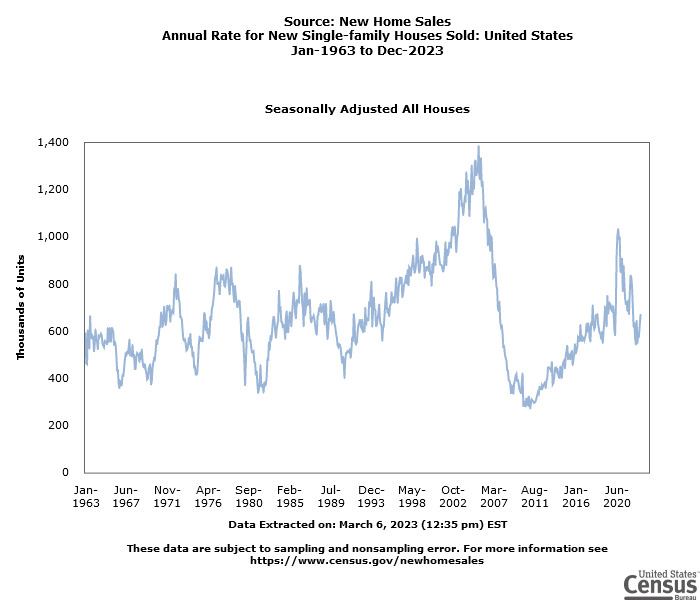
- When compared to 2007 levels, neither new or existing home sales reached the peaks of activity, both falling short by 25-30%
- Public builders have been fairly upbeat…TOL: “…we have seen a meaningful uptick in demand that started in January and continued through this past weekend..” 2/22/23
- Bottom line, the excesses of the Covid pandemic are working themselves out but limited supply should buffer the downside…and labor markets remain robust supporting demand…
- As for the near term in the stocks, we expect they will trade with mortgage rates which are ultimately driven by the level of interest rates…
- Given that we expect inflation to trend lower we would take advantage of housing related stocks if they were to trade in further
IMPORTANT DISCLOSURES The information in this report was prepared by Timber Point Capital Management, LLC. Opinions represent TPCM’s and IPI’s’ opinion as of the date of this report and are for general information purposes only and are not intended to predict or guarantee the future performance of any individual security, market sector or the markets generally. IPI does not undertake to advise you of any change in its opinions or the information contained in this report. The information contained herein constitutes general information and is not directed to, designed for, or individually tailored to, any particular investor or potential investor. This report is not intended to be a client-specific suitability analysis or recommendation, an offer to participate in any investment, or a recommendation to buy, hold or sell securities. Do not use this report as the sole basis for investment decisions. Do not select an asset class or investment product based on performance alone. Consider all relevant information, including your existing portfolio, investment objectives, risk tolerance, liquidity needs and investment time horizon. This communication is provided for informational purposes only and is not an offer, recommendation, or solicitation to buy or sell any security or other investment. This communication does not constitute, nor should it be regarded as, investment research or a research report, a securities or investment recommendation, nor does it provide information reasonably sufficient upon which to base an investment decision. Additional analysis of your or your client’s specific parameters would be required to make an investment decision. This communication is not based on the investment objectives, strategies, goals, financial circumstances, needs or risk tolerance of any client or portfolio and is not presented as suitable to any other particular client or portfolio. Securities and investment advice offered through Investment Planners, Inc. (Member FINRA/SIPC) and IPI Wealth Management, Inc., 226 W. Eldorado Street, Decatur, IL 62522. 217-425-6340.
Recent Comments