The Timber Log is a quick overview of Timber Point Capital’s most recent investment thoughts. If you have questions about the content, please reach out to Patrick Mullin. The information contained herein does not constitute investment advice or a recommendation for you to purchase or sell any specific security.
The Yield curve is steepening, just not the way most thought it would happen…
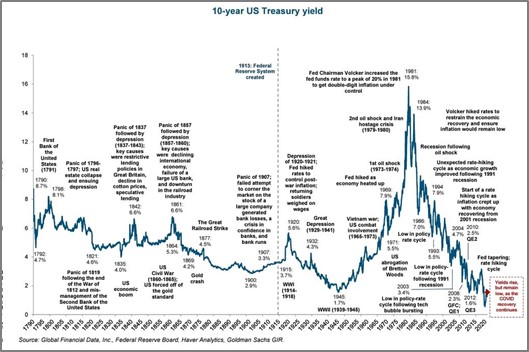
- Despite consistently improving inflation data, the US bond market has had a very difficult three months as long term interest rates, as shown by the 10 year graph below, have risen almost 80 bp’s to over 4.30%.
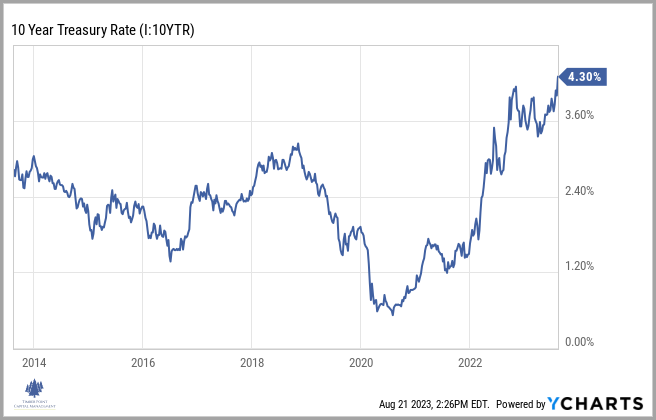
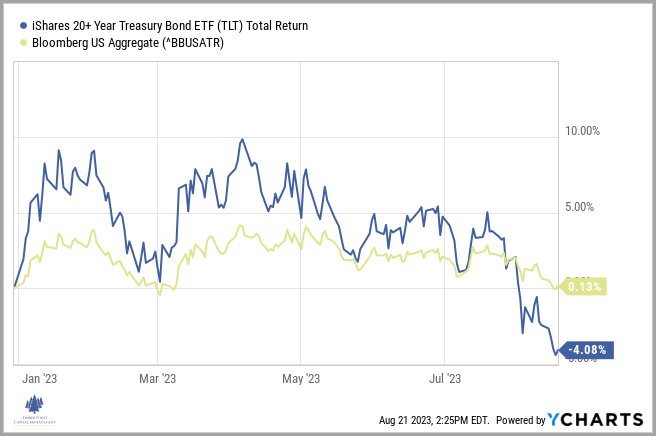
- YTD broad bond market returns are now flat, after rising nearly 3% in 1Q. If bond returns were to finish 2023 negative it would mark the third consecutive negative return year for fixed income, which has never happened before.
- Longer maturity US Treasuries particularly have experienced a meaningful backup in yields and and corresponding negative price returns.
- Fear, uncertainty, and doubt run high among bond investors today as their fundamental worry list includes:
- Spiraling, out of control spending in Washington, a growing US Treasury issuance calendar and rising Federal interest expense.
- A Fitch downgrade of US government securities.
- Persistent selling of Treasuries by foreign investors including large holders such as China, Japan and Saudi Arabia.
- Restrictive monetary policy including high(er?) short term rates and a reduction in the Fed balance sheet.
- Higher oil prices, which may portend resurging inflation pressures.
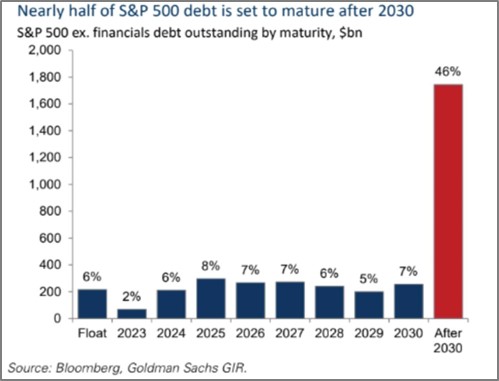
- Despite all the volatility within rates, credit spreads remain tight, however, as corporations have done an outstanding job managing their balance sheets.
- Refinancing risk is extraordinarily low as corporate treasurers termed out their debt at the interest rate lows in 2020 and 2021.
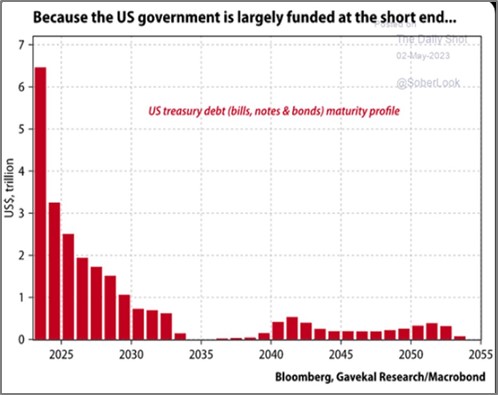
- By comparison, US Treasury debt continues to be financed on the short end of the curve contributing to the growing sense of incompetency within the Washington money crowd; further increasing interest rate volatility and selling pressure of government bonds.
- We have long believed that interest rate normalization would be a long and painful process as we move away from the Quantitative Easing era to something that is more “normal”.
- QE allowed for many imprudent economic decisions in both the private and public sector.
- Savvy corporate treasurers, however, took advantage of all-time, world history lows by terming out their debt. Politicians not so much.
- Global investors, at large, are now determining what the appropriate rate should be to lend to a $33 trillion indebted government. It appears that something in the 5% to 6% range seems about right and would be quite normal when looking at history.
- Despite all this rate anxiety, one economic variable that appears to be overlooked is an improving economic environment. Recessionary fears have fallen and forecasts for GDP growth are increasing.
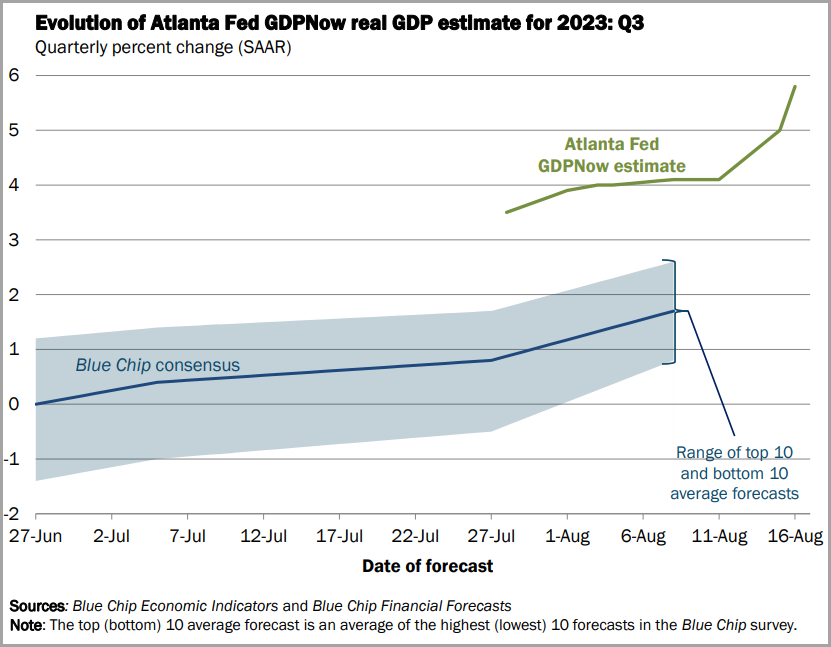
- Although still early (see note below), the Atlanta Fed now estimates 3Q real GDP to rise 5.8%…if this proves true, this would certainly be a contributing factor to higher long-term rates.
- Will the effect of higher rates have an impact on the economy? Yes, it has, and yes, it will. Excesses will continue to be corrected (see real estate).
- Yet, thus far the broad economy appears to be handling the normalization process reasonably well as economic and financial conditions remain in solid shape and the most recent calls for monetary Armageddon, like others in the past, are likely overdone.
What is the Atlanta Fed GDPNow telling us…and does it matter?
- Much has been made recently of the Atlanta Fed’s GDPNow estimate of 5.8% for 3Q23 real GDP growth…and rightly so, that is a big number!
- This is especially eye opening when compared to the Blue Chip Consensus estimate range of .8% – 2.5%, which is a forecast from 50 plus economists from America’s largest financial, manufacturing and insurance firms.
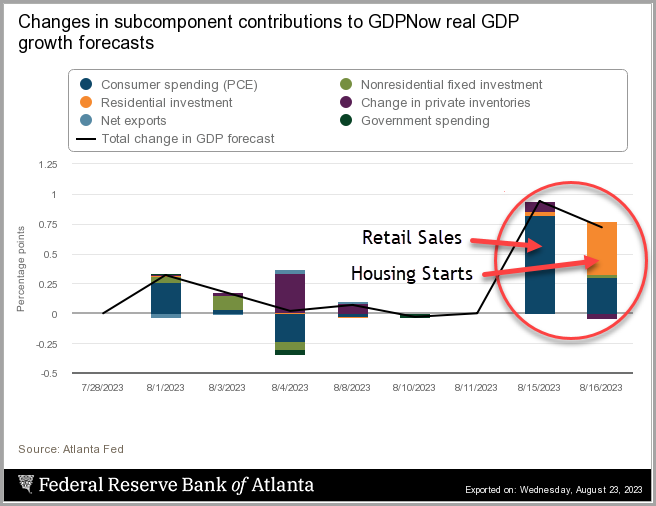
- After remaining static for a few weeks in July, the GDPNow estimate has lifted on the back of mid August economic reports including retail sales, housing starts and industrial production, as can be seen below from the subcomponents contribution chart…
- This begs the question, what is the GDPNow trying to accomplish and how is it calculated?
- First, the GDPNow is not an official forecast of real GDP growth by the Atlanta Fed or the FOMC…rather it is an attempt to “nowcast” economic activity in the current period
- It attempts to mimic the methods used by the Bureau of Economic Analysis (BEA) to estimate the BEA’s advance (first) real GDP estimate of the prior quarter…
- For example, the BEA will produce its advanced estimate of 3Q23 real GDP growth on October 26, 2023…the advance estimate uses public data released during 3Q23 which can be gleaned from the BEA’s Key Source Data and Assumptions table included in the report…
- GDPNow essentially “mirrors the key elements of the data construction machinery of the BEA” to create a relatively precise estimate of the BEA’s advance estimate…for more, click here
- For those unknown future GDP components, an ARIMA (autoregressive integrated moving average) is used which is a statistical analysis model that uses time series data to predict future trends…as data becomes known, the figures in the model are adjusted
- Why is this important? Real GDP as measured by the BEA is a key metric of the pace of economic activity…and it is one of the four variables included in the economic projections for every other FOMC meeting as it is reported on or just after FOMC meetings
- Looking back to 3Q2011, GDPNow has done a reasonably good job estimating the BEA advanced number with its Final GDPNow forecast, as seen below…
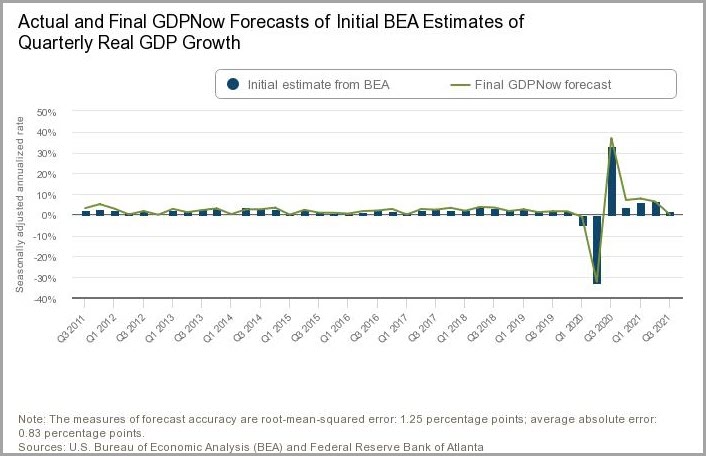
- Importantly, this accuracy is dependent on a full quarter of economic figures…
- Seen below, the forecast error is quite high early in the quarter when only limited real time data points are available with the balance of the figures represented by ARIMA modeling
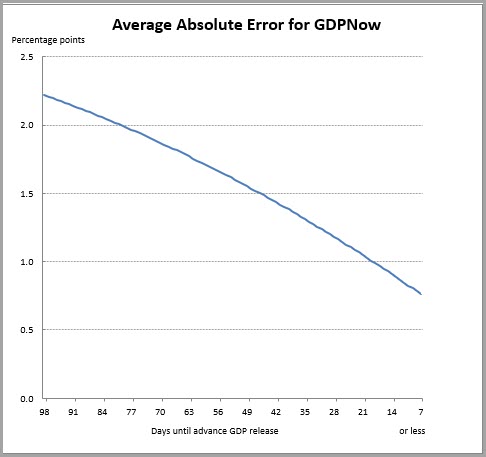
- Since the current version of this model has been tracked in 2011, the average absolute error of Final GDPNow forecasts is 79 bp’s…
- Given the next BEA advance estimate is on October 26th, we are still 65 days away from the release…according to the chart above, the average absolute error for GDPNow at 65 days is 175 bp’s…
- Interestingly, at the 65 day mark since 2Q14 and through 2Q23 (37 quarters), GDPNow has tended to overestimate the BEA advance estimate roughly 70% of the time
- Looking back over time at the 65 day mark, there have been larger than average discrepancies but these were primarily during the Covid era…
-
- March ’20 – GDPNow 65-day figure of 2.5% vs. BEA advance estimate of -4.8%
- June ’20 – GDPNow 65-day figure of -41% vs. BEA advance estimate of -33%
- September ’20 – GDPNow 65-day figure of 25.4% vs. BEA advance estimate of 33%
- GDPNow is truthful about its own shortcomings stating, “the regression (above) is estimated over the 2011q3-present sample; a period that does not include any recessions announced by the NBER. Therefore, this chart likely overstates the accuracy of the model forecasts.”
- While we have since had a recession (Covid), it was certainly not a garden variety recession so the Atlanta Fed’s statement should still be heeded…
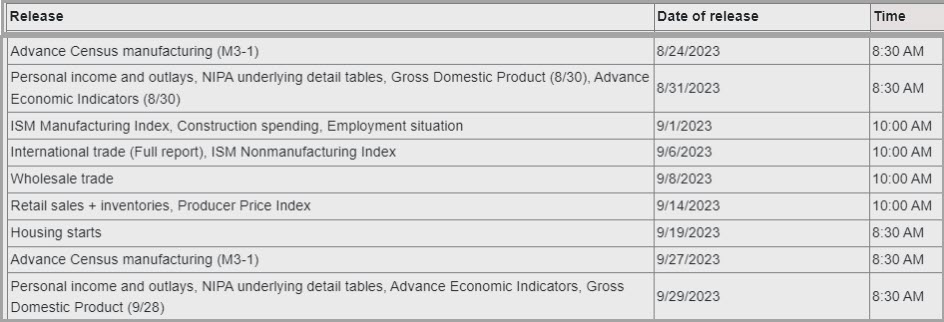
- Bottom line, GDPNow is not perfect, nor does it claim to be…its usefulness as a predictor of the BEA’s advance estimate of real GDP increases as more real time data points are added…given its history of over estimating at the 65 day mark, there remains the potential for a large variance from the now stated 5.8% 3Q growth estimate…future economic releases with dates are below.
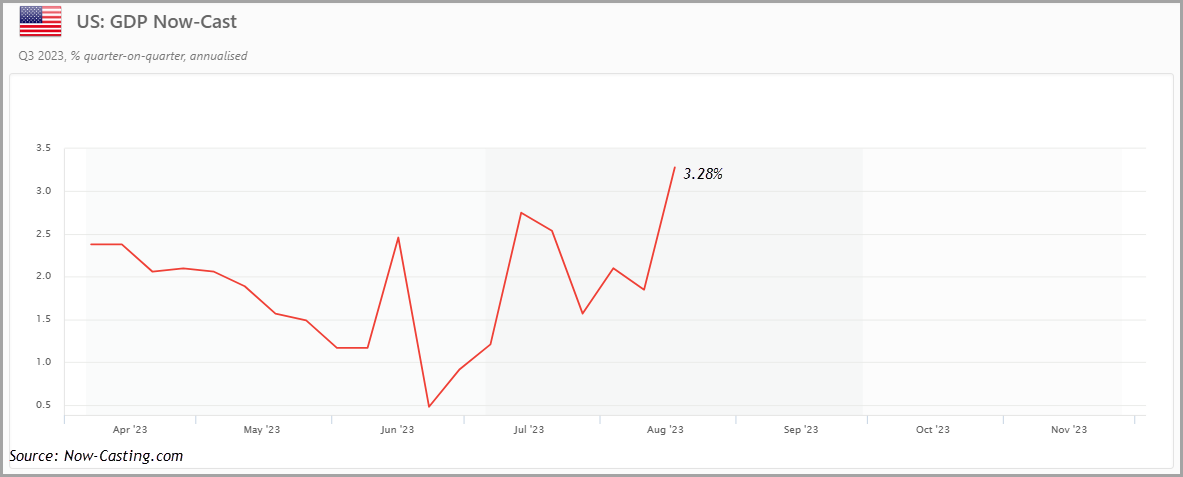
- Perhaps as a complement to GDPNow, the Atlanta Fed website lists a link to Now-Casting.com which provides a bit more muted view of 3Q23 economic activity with a 3.28% estimate…
__________________________________________________________________________________________________________________________________________________________________
IMPORTANT DISCLOSURES The information in this report was prepared by Timber Point Capital Management, LLC. Opinions represent TPCM’s and IPI’s’ opinion as of the date of this report and are for general information purposes only and are not intended to predict or guarantee the future performance of any individual security, market sector or the markets generally. IPI does not undertake to advise you of any change in its opinions or the information contained in this report. The information contained herein constitutes general information and is not directed to, designed for, or individually tailored to, any particular investor or potential investor. This report is not intended to be a client-specific suitability analysis or recommendation, an offer to participate in any investment, or a recommendation to buy, hold or sell securities. Do not use this report as the sole basis for investment decisions. Do not select an asset class or investment product based on performance alone. Consider all relevant information, including your existing portfolio, investment objectives, risk tolerance, liquidity needs and investment time horizon. This communication is provided for informational purposes only and is not an offer, recommendation, or solicitation to buy or sell any security or other investment. This communication does not constitute, nor should it be regarded as, investment research or a research report, a securities or investment recommendation, nor does it provide information reasonably sufficient upon which to base an investment decision. Additional analysis of your or your client’s specific parameters would be required to make an investment decision. This communication is not based on the investment objectives, strategies, goals, financial circumstances, needs or risk tolerance of any client or portfolio and is not presented as suitable to any other particular client or portfolio. Securities and investment advice offered through Investment Planners, Inc. (Member FINRA/SIPC) and IPI Wealth Management, Inc., 226 W. Eldorado Street, Decatur, IL 62522. 217-425-6340.[/et_pb_text][/et_pb_column]
[/et_pb_row]
[/et_pb_section]
Recent Comments