The Timber Log is a quick overview of Timber Point Capital’s most recent investment thoughts. If you have questions about the content, please reach out to Patrick Mullin. The information contained herein does not constitute investment advice or a recommendation for you to purchase or sell any specific security.
Source: TPCM and YCharts
The SPX in 2H23…more of the same or turning over a new leaf?
- Remember the old line about markets doing their best to frustrate the largest amount of investors?
- That is again the case in 2023 as most investors were cautiously positioned after a difficult 2022 and anticipating a possible Fed induced recession
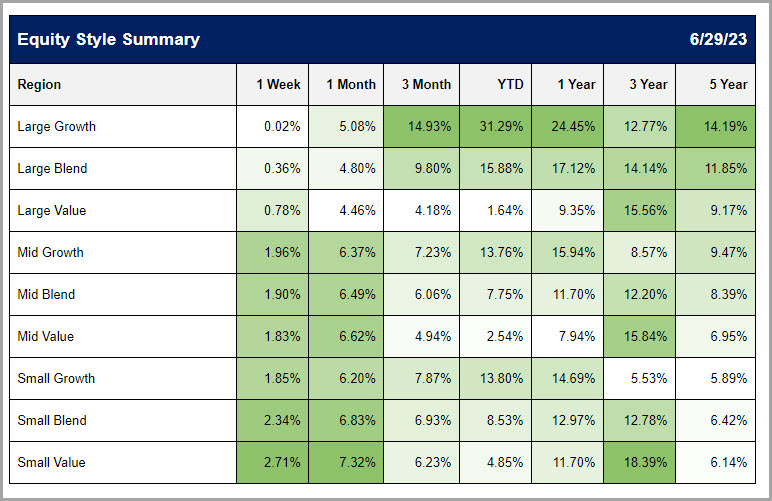
- Despite investor fear, the SPX has returned 15+% YTD…surprising yes, but the composition of the gains is what has left most investors frustrated
- Large cap growth has been the clear winner, up almost 30% YTD…this has been led by the reemergence of the FAANG+MTN (MSFT/TSLA/NVDA) names…the Growth style down the market cap spectrum has also outperformed but lagged the Large cap space
- As a large cap manager, if you didn’t own FAANG+MTN OR happened to pass on cruise, homebuilders or building material stocks, it would have been tough to keep up with the SPX return
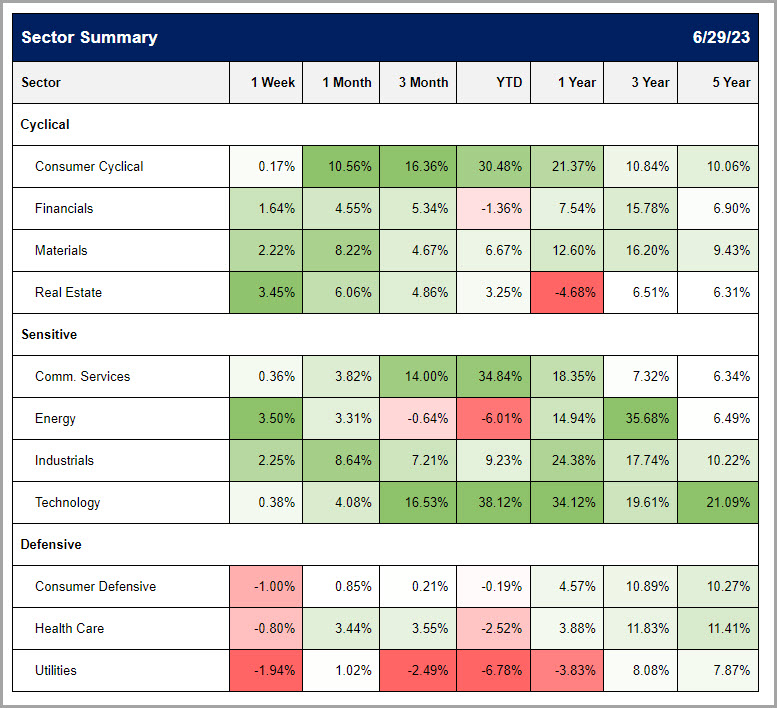
- Consumer Cyclical, up 27% YTD, Communication Services up 33% YTD and Technology up 35% YTD were the big winners lifting aggregate index returns
- These sectors are heavily weighted to FAANG +MTN which have vastly outperformed the SPX averages…all of these names are between 10% and 25% of their sectors and have YTD performance of 35% on the low end (GOOGL) and 133% on the high end (META)…
- NVDA is the outlier in this group at only 5% of the Technology sector but its stock price has almost tripled YTD…
- Diversification has not worked as 4 of 11 sectors will end in negative territory and 2 sectors are basically flat…Materials and Industrials have eked out mid single digit gains, nothing to sneeze at but not keeping pace with the SPX return
- We think the rubber band has been stretched too far on the valuation side as the FAANG+MTN names are trading at over 30x on a P/E basis…AMZN is the most expensive at 62x while GOOGL is the cheapest at 21x…AAPL now has a market cap that is greater than the entirety of the R2K…
- The market cap share of the SPX represented by these names is 27%, a new high, and up from 17% to start 2023….
- We think the extraordinary gains have been fueled by AI enthusiasm, return of margin discipline via cost cutting and project rationalization as well as global investors seeking secular growth names that are lacking in their markets…ex the FAANG+MTN names, the SPX is trading at 16x…
- Thus, we want to be a bit contraryhere…it is hard to pinpoint why the tide will turn but we know that it does eventually…we will incrementally place more bets on Equal Weight SPX 500 (RSP) and move down the market cap spectrum to small and mid-caps where there are compelling valuation metrics relative to historical norms…this is in addition to our opportunistic approach to individual names, ETF’s or indices
- No doubt the strength in large cap tech could continue but it is interesting how many times quarter end can create an inflection point for different styles and assets classes to outperform as rebalancing occurs…we will take that bet now
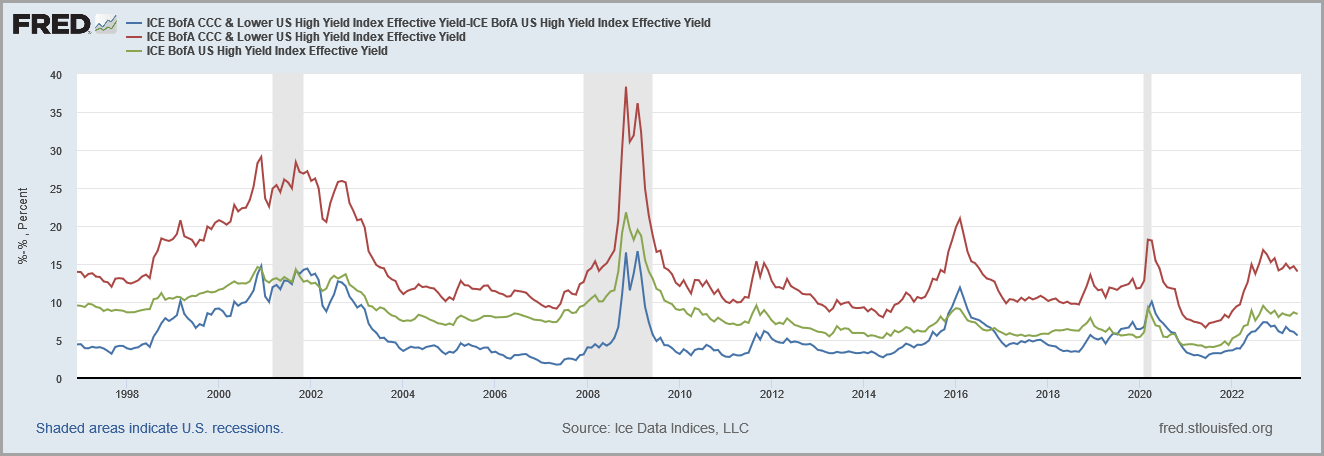
Credit markets shake off the March Bank Swoon…
- CCC yields (red line), the riskiest element with High Yield, have declined to Feb ’23 levels, prior to SVB/SBNY/FRC bankruptcies…sporting 14% yields, they are 2x mid ’21 Covid lows
- CCC’s yields are still well below “blow out” yields in prior recession periods of 20%…yet another sign that recession calls may be premature
- Default rates on high yield bonds have risen but are not spiking…corporate balance sheets have historically low leverage suggesting defaults should remain subdued
- High yield bonds in the 9% range are also roughly 2x the level just two years ago and relatively attractive to longer term levels, ex recession “blow outs”
- High yield is a risk asset class and will have greater volatility vs. higher credit quality markets like investment grade corporates…there will be difficult periods of ownership no doubt…
- If picking individual securities, credit work is of paramount importance as it is unlikely the Fed will come riding to the rescue again
- If purchasing HY bond funds, it is important to under differences between issuers, sector concentrations and geographies…buyer be smart!
- Bottom line, we think high yield portfolio/fund offers investors a reasonable risk return scenario in today’s environment…
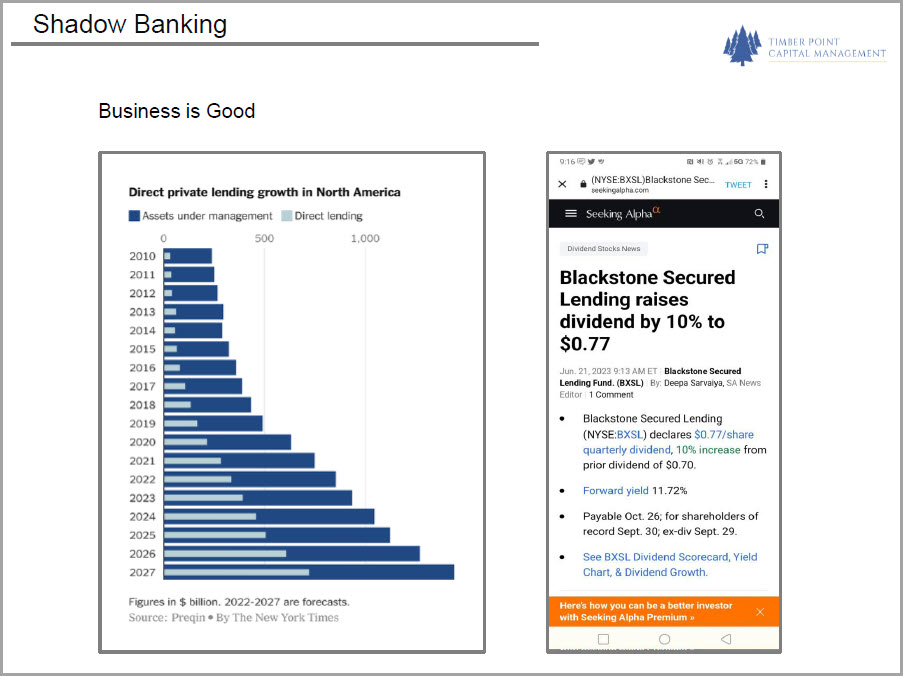
Full speed ahead for the Shadow Bankers…recent turmoil creates more opportunity
- What are “shadow” bankers? Lenders that are outside of the realm of traditional regulated banking…the Fed published a paper on the subject in 2012, this is not new news…
- We think the biggest outcome of the recent banking bankruptcies (SVB, etc) will be increased capital requirements for small and mid-sized asset banks along with greater regulatory scrutiny
- Hence, there has been and will continue to be a talent exodus to less regulated and higher return endeavors outside the established regulatory purview…
- In the early days, growth was fueled by the search for higher yielding instruments…since then, private credit funds have successfully raised almost $1.1 trillion through ’22…this compares to a $1.5T high yield market
- Issuers are taking advantage of growing liquidity to side-step public market offerings and the void left by traditional bankers who have retreated from servicing smaller and mid-size companies
- Institutional and HNW investors are the primary investor base including traditional public and private pension funds
- The Fed is aware of the potential risks…but believes they are “limited” owing to limited leverage and lower investor redemption risks…albeit acknowledging that default risk is difficult to assess
- While not flying below the Fed’s radar, shadow bankers are operating largely unregulated and therefore the market is self policing, without any notable “issues” yet…however, the shadow banking industry has not had to deal with a protracted economic decline to truly stress test it resiliency
- Public companies participating in the shadow banking space are ARES, OWL, BX, BLK to name a few…we continue to monitor and evaluate the space

How the Fed lost its Compass – the Volcker Rule…Victor Canto, PhD
Our economic consultant, Victor Canto, PhD, has posted a new article…click here to read
- The Volcker rule states that any departure from the 2% inflation rate triggers an open market operation to either reduce/expand the Fed’s balance sheet – a very mechanical approach
- Under such, the Fed’s balance sheet will exactly match the monetary base (chart above, pre 2009)…the Fed balance sheet is nothing more than the cumulative sum of all the open market operations
- However, under Bernanke, the Fed sought to forecast changes in money and credit demand and accommodate them before they occurred…aka “flexible inflation targeting”
- But is this possible? Only if forecasting acumen is good enough to correctly anticipate shifts in demand and accommodate them faster than the Volcker rule
- During the Financial Crisis, Bernanke acted quickly and decisively to provide liquidity and prevent the deflationary spiral…crisis averted, M2 growth was reduced and inflation returned to target
- However, Bernanke did not undo its balance sheet expansion…this was the beginning of the Fed’s asymmetric response – quick to add liquidity and slow to remove it for fear of an economic slowdown
- To dampen monetary expansion, the Fed induced banks to hold “excess reserves” by paying banks interest so they would not be used as currency in circulation or reserves to back deposits
- Voila, excess reserves allowed the Fed to print dollars without a subsequent increase in the quantity of M2 or the inflation rate…but also led to monetary and credit distortions that impacted the banking system’s credit creation and asset valuation in the real economy
- In late 2014, the Fed began to reduce its balance sheet and excess reserves as a % of M2…this continued until Covid necessitated the Fed again expanding its balance sheet
- However, Powell resorted to Overnite Reverse Repos, rather than interest on excess reserves, to prevent an increase in the monetary aggregates from filtering into the economy
- Importantly, Powell noted that “we have also made important changes with regard to the price stability side of our mandate…in seeking to achieve inflation that averages 2% over time, we are not tying ourselves to a particular mathematical formula that defines the average…”
- Powell’s Covid response was to “super-size” Bernanke’s Financial Crisis policies and focus on Reverse Repos to control the monetary aggregates
- However, price stability proved illusory and proved Fed policy either a failure or subservient to other Fed policy objectives. Either way, the Fed’s Volcker rule compass appears to have been lost…
IMPORTANT DISCLOSURES The information in this report was prepared by Timber Point Capital Management, LLC. Opinions represent TPCM’s and IPI’s’ opinion as of the date of this report and are for general information purposes only and are not intended to predict or guarantee the future performance of any individual security, market sector or the markets generally. IPI does not undertake to advise you of any change in its opinions or the information contained in this report. The information contained herein constitutes general information and is not directed to, designed for, or individually tailored to, any particular investor or potential investor. This report is not intended to be a client-specific suitability analysis or recommendation, an offer to participate in any investment, or a recommendation to buy, hold or sell securities. Do not use this report as the sole basis for investment decisions. Do not select an asset class or investment product based on performance alone. Consider all relevant information, including your existing portfolio, investment objectives, risk tolerance, liquidity needs and investment time horizon. This communication is provided for informational purposes only and is not an offer, recommendation, or solicitation to buy or sell any security or other investment. This communication does not constitute, nor should it be regarded as, investment research or a research report, a securities or investment recommendation, nor does it provide information reasonably sufficient upon which to base an investment decision. Additional analysis of your or your client’s specific parameters would be required to make an investment decision. This communication is not based on the investment objectives, strategies, goals, financial circumstances, needs or risk tolerance of any client or portfolio and is not presented as suitable to any other particular client or portfolio. Securities and investment advice offered through Investment Planners, Inc. (Member FINRA/SIPC) and IPI Wealth Management, Inc., 226 W. Eldorado Street, Decatur, IL 62522. 217-425-6340.[/et_pb_text][/et_pb_column]
[/et_pb_row]
[/et_pb_section]
Recent Comments